present
Sign up and get $50 off your first purchase
Trading product for Supply Demand Quadra Zones Indicator EMA Key Levels, image 1
Supply Demand Quadra Zones
Indicator
Version 1.0, Sep 2026
Windows, Mac
Trading product for Supply Demand Quadra Zones Indicator EMA Key Levels, image 2
Trading product for Supply Demand Quadra Zones Indicator EMA Key Levels, image 3
Trading product for Supply Demand Quadra Zones Indicator EMA Key Levels, image 4
Trading product for Supply Demand Quadra Zones Indicator EMA Key Levels, image 5
Trading product for Supply Demand Quadra Zones Indicator EMA Key Levels, image 6
Trading product for Supply Demand Quadra Zones Indicator EMA Key Levels, image 7
Trading product for Supply Demand Quadra Zones Indicator EMA Key Levels, image 8
Trading product for Supply Demand Quadra Zones Indicator EMA Key Levels, image 9
Trading product for Supply Demand Quadra Zones Indicator EMA Key Levels, image 10
Trading product for Supply Demand Quadra Zones Indicator EMA Key Levels, image 11

Description

Supply Demand Quadra Zones puts an entry signal, a drawn risk plan and your wider market context on one chart.


WHAT IT DRAWS


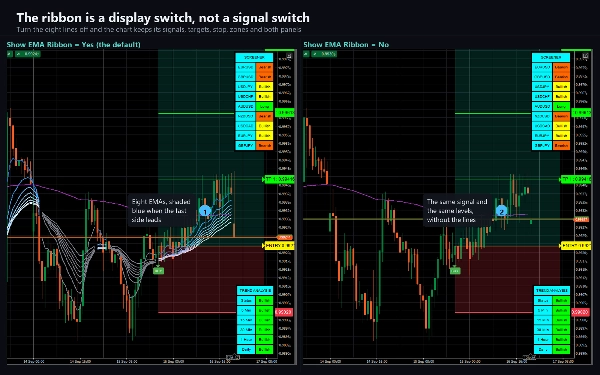
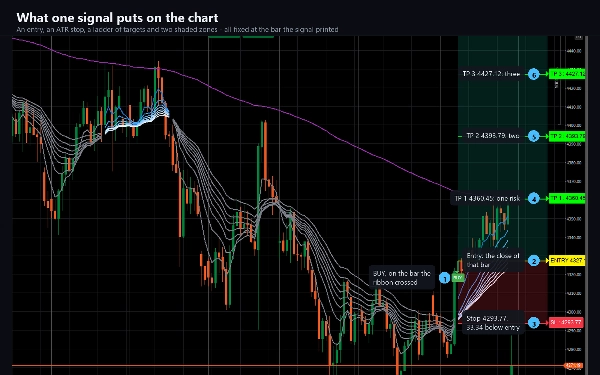
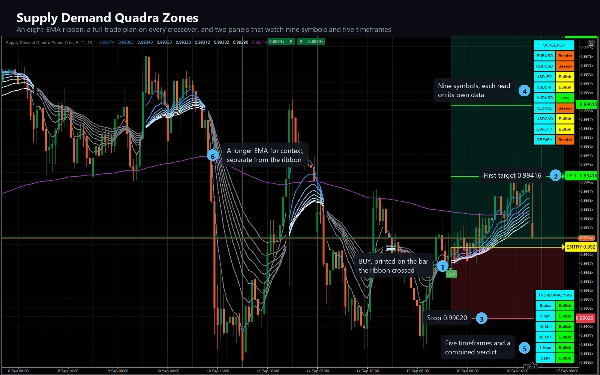
An eight-line EMA ribbon (5, 11, 15, 18, 21, 24, 28, 34) that turns blue while the fast leg leads and grey when it does not, plus a 200-period reference line. When EMA 2 crosses above EMA 8 a BUY plate is drawn; when it crosses back a SELL plate appears.


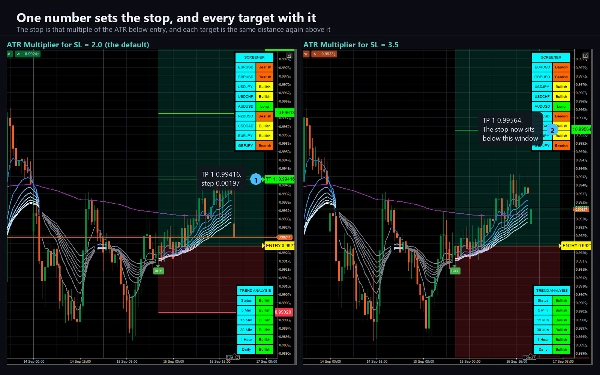
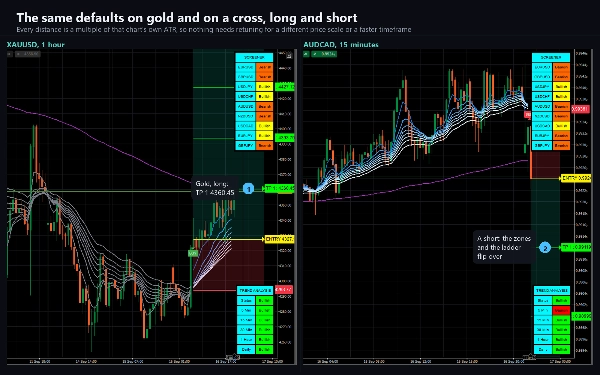
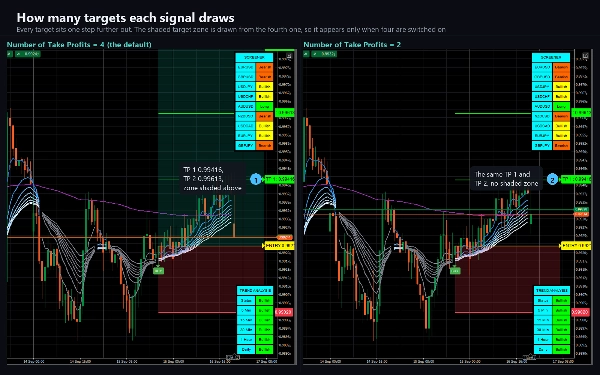
Every signal comes with a complete risk plan already on the chart: an entry line, a stop placed at an ATR multiple, and up to four take-profit levels spaced as multiples of that stop distance. At the default settings the ladder is 1R, 2R, 3R and 4R. Each level carries its own price tag at the right edge, and the space between entry and target and between entry and stop is shaded so the shape of the trade is readable at a glance. The whole plan tracks forward with price and freezes when the trade resolves - either the stop is touched or every enabled target has been reached.


THE TWO PANELS


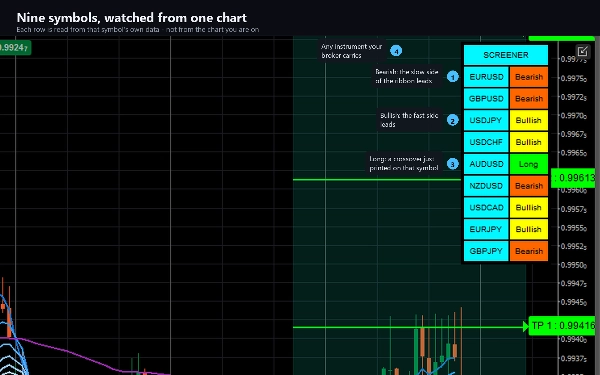
A screener classifies up to nine symbols of your choosing - all read at the chart's own timeframe - as Long, Short, Bullish or Bearish, so you can see which other markets are lining up the same way without opening nine charts.


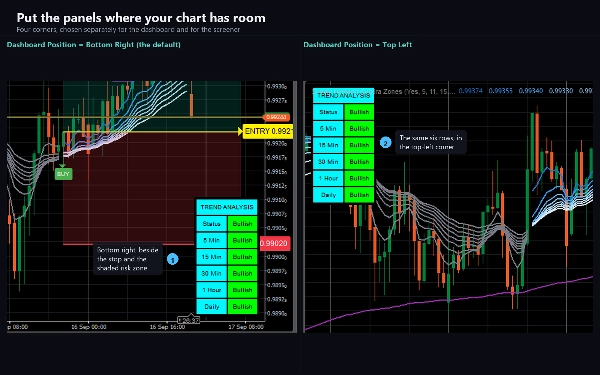
A trend dashboard reports 5-minute, 15-minute, 30-minute, 1-hour and daily direction for the chart symbol, plus a combined Status row decided by a majority vote of three timeframes you pick.


WEBHOOK


Every signal, and every step of the trade that follows it, can be POSTed as JSON to a URL you choose - so an external bot, journal or notification service can act on it without anyone watching the chart. It sends the side, the entry, the stop and the full target ladder, then a message for each target reached, for the stop, and for the trade closing. It is off until you fill in the URL, it never fires while history is loading or during a backtest, and it needs no elevated permissions.


Alerts also deliver through the cTrader log, a sound and e-mail.


REPAINTING, STATED PLAINLY


The BUY and SELL signals do not repaint. They are decided on closed bars and never move once drawn.


The two panels do repaint. Both are drawn on the live bar and read developing higher-timeframe data, so their cells can change until those bars close. Treat them as a live picture of where things stand, not as a record of what happened.


SETTINGS


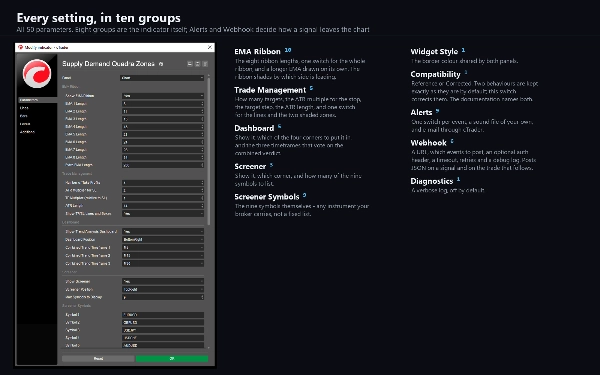
50 parameters. All eight ribbon lengths, the ATR multiplier and target spacing, the number of targets, both panel positions, all nine screener symbols, the three dashboard timeframes, the border colour, the alert channels and the webhook. A Compatibility setting chooses between two behaviours for the 4-hour dashboard option and the shaded target zone - the documentation explains exactly what each does and why the default is what it is.


SUITED TO


Any instrument and any timeframe the platform offers. The ribbon needs 34 bars before it is fully formed and 200 for the reference line, so very short histories will show fewer lines than a long one.


Trading involves risk. Past performance does not guarantee future results.

Summary

Indicator profile
Indicator category
Trend
Output type
Signals
Data requirements
Bars only
Supported signals
Cross

Customer reviews

0.0
Reviews: 0
Customer reviews
No reviews for this product yet. Already tried it? Be the first to tell others!

Discussion

FAQ

EMA
Key Levels
Supply & Demand
ATR
Products available through cTrader Store, including trading bots, indicators and plugins, are provided by third-party developers and made available for informational and technical access purposes only. cTrader Store is not a broker and does not provide investment advice, personal recommendations or any guarantee of future performance.

More from this author

Indicator
ATR
CCI
+4
A trend line that never steps back, a shaded band to the price, and a pointer at the swing where the trend turns.
Indicator
ADX
ATR
+5
SuperTrend signals scored on five confluence factors, with an ATR stop, three targets and a dashboard.
Indicator
ATR
RSI
+4
RSI bands drawn on price, confluence-scored BUY/SELL signals, an ATR stop with three targets
Indicator
ADX
ATR
+5
Ten confluence layers scored on every closed bar, with an anti-chop gate, pivot levels and a live dashboard.
Indicator
Volume
Channel
+3
A higher-timeframe log-regression channel with a volume profile, Point of Control and session levels.
Indicator
Volume
Key Levels
+1
Fixed-grid volume profile: bull and bear volume at every price level, with Point of Control and value area.
Indicator
ATR
BOS
+5
Know how strong each Supertrend flip is: scored BUY/SELL, structure stop + 3 targets, live win-rate dashboard, alerts.
Indicator
ATR
EMA
+3
EMA trend, RSI reclaim and divergence signals with ATR stop and two targets, swing levels and a 16-row dashboard.
Indicator
Key Levels
Order Block
+5
Order blocks, fair value gaps, liquidity sweeps and a 24-timeframe signal scanner on one chart.
Indicator
ADX
ATR
+5
EMA-cross signals scored on six confluence layers, with an ATR stop, three targets and a live panel
Indicator
ADX
ATR
+5
Range-filter BUY/SELL flips with an ATR or swing stop, three targets, five confluence stars and a live panel
Indicator
ATR
EMA
+4
Range-filter BUY/SELL signals scored by four confluence layers, with a stop, five targets and a trend panel

You may also like

Indicator
Engulfing
Fibonacci
+4
Six higher-timeframe candle sets on one chart, with liquidity sweep detection and swept levels.
Indicator
Pin Bar
Inside Bar
+2
Advanced candlestick pattern recognition with structural quality scoring, alerts and adaptive chart visuals.
Indicator
Prop
Forex
+13
Color Volume Bars – Visualize Market Strength Instantly
Indicator
RSI
MACD
Unlock market insights with our Multi-Timeframe Market Levels indicator, enhancing your trading strategies effortlessly
Indicator
ATR
RSI
+9
🚀 MACARX Indicator - The Multi-Indicator Trend Fusion 🚀
Indicator
BOS
MSS
+3
Advanced indicator to highlight key execution context and help aligning structure, location, and risk.
Indicator
SMC
Prop
+8
KILLZONES AND MACRO SESSIONS
Indicator
MSS
Key Levels
+2
Fractal based market structure indicator that identifies HH, HL, LH, and LL pivot with confirmed, non-repainting fractal
Indicator
Volume
Key Levels
+2
Support and resistance from a rolling volume profile, ranked by strength or recency, updated live.
Indicator
AI
ATR
+5
"Advanced VSA & CVD indicator with 'A+ Setup' filtering based on Support & Resistance levels."
Indicator
Forex
Alerts you when price touches Fibonacci levels. Stay organized and trade efficiently!
Indicator
ATR
RSI
+4
RSI bands drawn on price, confluence-scored BUY/SELL signals, an ATR stop with three targets
Indicator
ATR
RSI
+16
Multi-timeframe trend indicator using EMA, MACD & ADX to confirm high-probability buy and sell bias.
Indicator
ATR
RSI
+5
Advanced Anchored VWAP for cTrader: volatility bands, real‑time alerts & customizable session resets.
Indicator
RSI
VegaXLR's cTrader StochRSI identifies overbought/oversold RSI levels for precise trade entries.
Indicator
AI
ATR
+26
Entry Momentum MACD Power Guide
Indicator
Prop
Forex
+4
Draws pivots (P, S/R, CPR) from selected anchors like H1–Month1, with optional mid-levels (PS1, S1S2, etc.)
Indicator
ATR
EMA
+4
SCALPING M1 CTRADER v1.0 — Institutional-Grade M1 Gold & Forex Scalping System

Price

3
Sales