
Descripción
Indicadores de Pinescriptlabs Store: Pinescriptlabs Store cBots : (cBot) Gold & BTC BreakoutSession Pivots(nuevo)
Proyección de Liquidez de Precio ZigZag
Algoritmo Inteligente de Seguimiento (nuevo)
Mapa de Liquidación de Apalancamiento
Predicción Basada en Linreg y ATR
Soporte y Tendencia SmartTrend
Resistencia
Líneas
Sesiones de Brecha de Valor Justo
Análisis
Dinámico de Estructura
del Mercado
de
Puntos
de Giro
Regresión
Lineal
de Fibonacci
Multitemporal
Brecha de Valor Justo de Momentum
Proyección del Flujo del Mercado
Gradiente de Tendencia Dinámico
Rastreador de
Sesgo de Velas
Multinivel
Rastreador de Extremos Zig-Zag
Líneas
de Tendencia de
Soporte y
Resistencia
Automáticas
Todos
los Niveles de
Soporte y
Resistencia
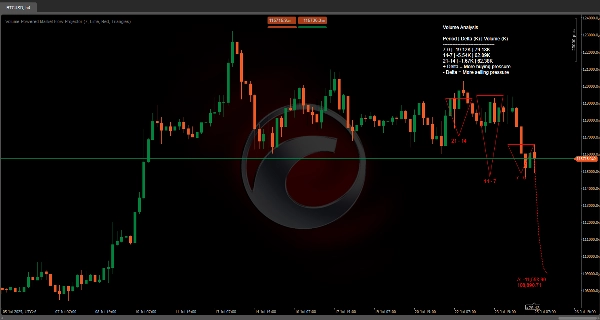
📊 Proyección del Flujo del Mercado:
El indicador FutureTrend está diseñado para analizar y proyectar dinámicamente el comportamiento del mercado integrando datos de precio y volumen a través de múltiples dimensiones temporales. Sus funcionalidades clave incluyen:
⏳ Análisis de Tres Períodos
📈 Calcula los precios promedio (máximos y mínimos) y el volumen delta (diferencia entre presión de compra y venta) a lo largo de tres períodos consecutivos definidos por el parámetro Period.
🔍 Esta vista consolidada de movimientos históricos ayuda a identificar tendencias dominantes y cambios en el comportamiento del mercado.
🚀 Proyección de Línea de Tendencia Futura
📊 Usando un promedio ponderado de los volúmenes delta de los tres períodos analizados, el indicador proyecta una línea de tendencia futura que refleja la posible dirección del mercado.
🛠️ La proyección se ajusta dinámicamente usando factores de suavizado para evitar predicciones extremas.
🔷 Representación Visual de Formas
🎨 Los datos históricos se representan visualmente mediante formas geométricas (triángulos, círculos o cuadros) que ilustran la evolución del volumen y los rangos de precios para cada período.
🔴🟢 Los colores asignados (UpColor y DownColor) indican la tendencia predominante (alcista o bajista), facilitando una interpretación rápida.
🏷️ Volumen Delta Promedio y Etiqueta de Precio Futuro
📍 Al final de la línea de tendencia proyectada, una etiqueta muestra el volumen delta promedio y el precio futuro estimado, ofreciendo una referencia clave para movimientos potenciales de precio y la fuerza de la tendencia.
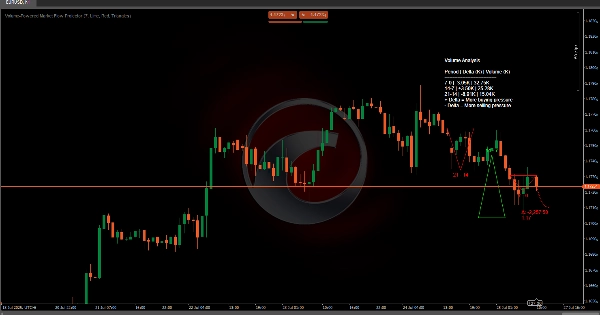
📋 Tabla de Datos de Volumen
📑 Proporciona una tabla detallada que desglosa los volúmenes totales y las diferencias delta para los tres períodos analizados.
📊 Esto permite a los traders comparar rápidamente los datos de volumen, interpretar el contexto del mercado y apoyar la proyección de la tendencia futura.
🔮 Dirección
Al combinar volumen y datos de precio, el indicador ofrece una herramienta robusta para predecir tanto la fuerza de la tendencia como posibles cambios en el comportamiento del mercado durante los próximos períodos.
Resumen
The indicator projects a future trendline based on a weighted average of delta volumes from the analyzed periods, dynamically adjusted with smoothing factors to prevent extreme predictions. Historical data is visually represented using geometric shapes—such as triangles, circles, or boxes—that illustrate volume and price range evolution for each period. Colors indicate prevailing trends, with distinct hues for bullish and bearish conditions.
At the end of the projected trendline, a label displays the average delta volume and estimated future price, providing a reference for potential price movements and trend strength. Additionally, a detailed volume data table breaks down total volumes and delta differences for the three periods, supporting market context interpretation and trend projection. By combining volume and price data, this tool aids in predicting trend strength and potential market behavior shifts.
Valoraciones de clientes
5 | 100 % | |
4 | 0 % | |
3 | 0 % | |
2 | 0 % | |
1 | 0 % |


