
ScalperSignalVisual
Indicador
191 descargas
Versión 1.0, Aug 2025
Windows, Mac
Descripción
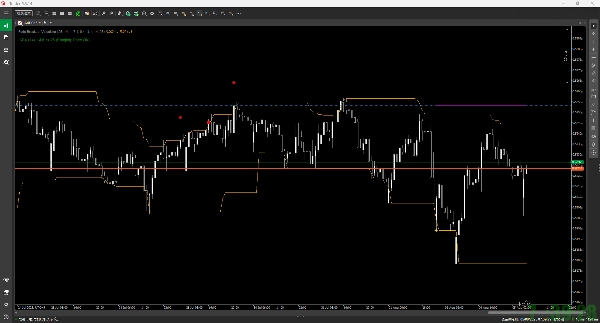
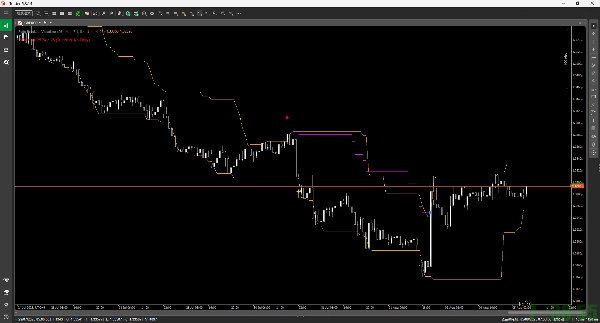
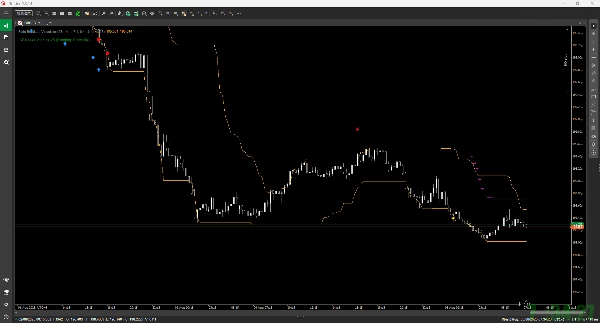
Este indicador es una herramienta para visualizar la lógica de trading de una estrategia contraria llamada "Fade Breakout" en su gráfico. No realiza operaciones reales, pero muestra cómo se gestionaría una posición desde la entrada hasta la salida cuando ocurre una señal.
Características clave
- Señales de entrada:
-
- Utiliza el Canal Donchian.
- Señal de compra (contraria): Cuando el precio rompe a la baja por debajo de la banda inferior del Canal Donchian, muestra una señal de compra (flecha azul hacia arriba ↑).
- Señal de venta (contraria): Cuando el precio rompe al alza por encima de la banda superior del Canal Donchian, muestra una señal de venta (flecha roja hacia abajo ↓).
- Gestión de riesgo:
-
- Al entrar, se dibujan un Stop Loss inicial (línea roja punteada) y un primer Take Profit (línea verde punteada), basados en el ATR (Rango Verdadero Promedio).
- Cuando se alcanza el primer Take Profit (TP1), aparece una estrella dorada (★) y el stop loss se mueve al precio de entrada (punto de equilibrio).
- Después, se activa un Trailing Stop basado en el ATR para asegurar ganancias siguiendo el precio. La trayectoria del trailing stop se muestra como una línea magenta.
- Salidas de operaciones:
-
- Stop Loss: Si el precio alcanza el nivel de stop loss, se marca con un cuadrado rojo (■).
- Salida por Trailing Stop: Si el precio alcanza el trailing stop, se marca con un cuadrado azul (■).
- Filtro ADX:
-
- Puede activar opcionalmente el filtro ADX.
- Si el ADX es mayor que un valor especificado (indicando una tendencia fuerte), desactivará nuevas señales de entrada. El estado actual (Entrada OK / Sin entrada) se muestra en el texto en la parte superior izquierda del gráfico.
Resumen
Perfil del indicador
Valoraciones de clientes
0.0
Valoraciones: 0
Valoraciones de clientes
Este producto todavía no se ha valorado. ¿Ya lo ha probado? Sea el primero en informar a otros.
Conversación
Preguntas frecuentes
Los productos disponibles a través de cTrader Store, incluidos bots, indicadores y plugins para operar, son proporcionados por desarrolladores de terceros y están disponibles únicamente con fines informativos y de acceso técnico. cTrader Store no es un bróker, por lo que no proporciona asesoramiento de inversión, recomendaciones personales ni ninguna garantía de rentabilidad futura.
Más de este autor


Precio
1
Ventas
1.33K
Instalaciones gratis