Descripción
VISIÓN GENERAL
El indicador Waddah Attar Explosion (WAE) fue creado por Ahmad Waddah Attar y presentado a la comunidad de trading en 2007. Combina la medición del momentum MACD con el análisis de volatilidad de las Bandas de Bollinger para identificar momentos de "explosión de precio": períodos en los que el precio pasa de consolidación a un movimiento direccional fuerte.
El indicador responde a dos preguntas:
- ¿Se está acumulando momentum? (medido por la tasa de cambio del MACD)
- ¿Está aumentando la volatilidad? (medido por el ancho de las Bandas de Bollinger)
Cuando ambas condiciones se alinean por encima de un filtro de ruido (Zona Muerta), señala un posible movimiento explosivo.
COMPONENTES
1. Histograma de Tendencia (Verde/Rojo) Muestra la tasa de cambio de la línea MACD, multiplicada por un factor de sensibilidad.
- Cálculo:
(MACD_actual - MACD_anterior) × Sensibilidad - Barras verdes: Momentum alcista (MACD acelerando hacia arriba)
- Barras rojas: Momentum bajista (MACD acelerando hacia abajo)
- Color brillante: Momentum aumentando en comparación con la barra anterior
- Color oscuro: Momentum disminuyendo en comparación con la barra anterior
2. Línea de Explosión (Blanca) Representa el ancho de las Bandas de Bollinger, indicando expansión o contracción de la volatilidad.
- Cálculo:
BB_Superior - BB_Inferior - Ascendente: Volatilidad en expansión (posible ruptura)
- Descendente: Volatilidad en contracción (consolidación)
3. Zona Muerta (Amarilla) Un filtro umbral para eliminar señales débiles causadas por el ruido del mercado.
- Basado en ATR: Se adapta a la volatilidad actual del mercado
- Pips Fijos: Valor umbral estático
CÓMO LO USA AHMAD WADDAH ATTAR
Según el autor original:
Reglas de Entrada para Comprar Todas las condiciones deben cumplirse:
- El histograma verde está subiendo
- El histograma verde está por encima de la Línea de Explosión
- La Línea de Explosión está subiendo
- Tanto el histograma verde como la Línea de Explosión están por encima de la Zona Muerta
Reglas de Entrada para Vender Todas las condiciones deben cumplirse:
- El histograma rojo está subiendo
- El histograma rojo está por encima de la Línea de Explosión
- La Línea de Explosión está subiendo
- Tanto el histograma rojo como la Línea de Explosión están por encima de la Zona Muerta
Reglas de Salida
- Salir de posiciones largas cuando el histograma verde cruza por debajo de la Línea de Explosión
- Salir de posiciones cortas cuando el histograma rojo cruza por debajo de la Línea de Explosión
Perspectiva Clave El ángulo de la Línea de Explosión es importante. Cuando la Línea de Explosión está inclinada hacia arriba y el histograma la supera, esto confirma que la volatilidad está aumentando activamente—la "explosión" es real, no una señal falsa.
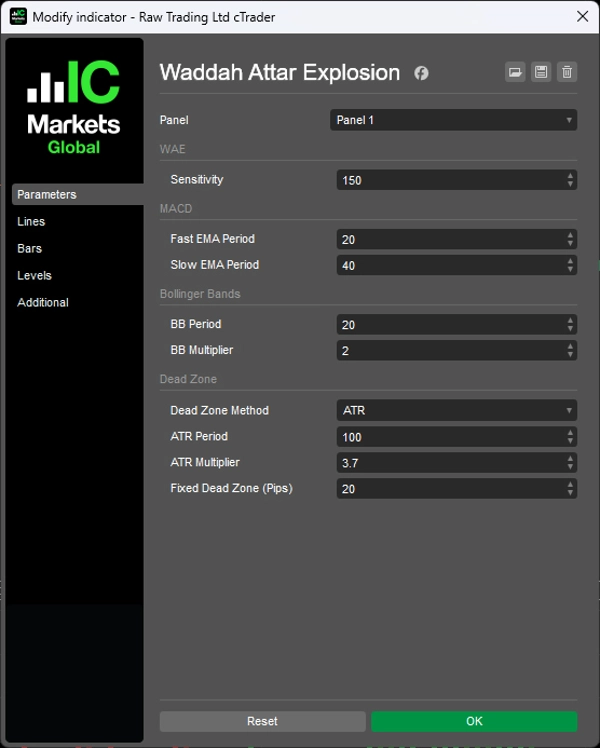
PARÁMETROS
1. Sensibilidad
- Sensibilidad (150): Multiplicador para la tasa de cambio del MACD
2. MACD
- Periodo EMA Rápida (20): Media móvil rápida para el cálculo del MACD
- Periodo EMA Lenta (40): Media móvil lenta para el cálculo del MACD
3. Bandas de Bollinger
- Periodo BB (20): Periodo de retroceso de las Bandas de Bollinger
- Multiplicador BB (2.0): Multiplicador de desviación estándar
4. Zona Muerta
- Método Zona Muerta (ATR): Elegir entre basado en ATR o Pips Fijos
- Periodo ATR (100): Periodo para el cálculo del ATR
- Multiplicador ATR (3.7): Multiplicador aplicado al ATR para la Zona Muerta
- Zona Muerta Fija (20): Valor de la Zona Muerta en pips (cuando se usa el método fijo)
NOTAS
- El indicador funciona en todos los marcos temporales. El autor original recomendó H1 y M30.
- Se recomienda la Zona Muerta basada en ATR ya que se adapta a diferentes instrumentos y condiciones de mercado.
- El parámetro de Sensibilidad puede necesitar ajuste según el marco temporal y la volatilidad del instrumento.
- Este indicador identifica la alineación de momentum y volatilidad—no predice la dirección por sí solo. Considere usarlo junto con análisis de tendencia o niveles de soporte/resistencia.
__________________________________________________________________________________________
MÁS INDICADORES GRATUITOS
Explora una amplia gama de herramientas de análisis de mercado—desde estructura y volumen hasta regresión, volatilidad y marcos temporales personalizados.
El código fuente está disponible en el repositorio de GitHub repository.
Todos son gratuitos para usar. Pero si quieres apoyar con un café, puedes hacerlo aquí.
Soporte/Resistencia
Volumen
- Perfilador de Actividad de Volumen
- Analizador de Eficiencia de Volumen
- Análisis de Perfil de Volumen
- Perfil de Volumen - Actualizado
- Análisis de Spread de Volumen
- VWAP (Precio Promedio Ponderado por Volumen)
Medias Móviles
- Canal SSL
- Media Móvil Anclada
- Media Móvil Escalada por Desviación
- Activador Gann High Low
- Línea de Tendencia Instantánea
- Media Móvil Adaptativa Kaufman con Visión de Tendencia
- Canal de Media Móvil
- Suite de Medias Móviles
- Media Móvil de Canal de Tendencia
Utilidades/Personalizados
Basado en Regresión
Volatilidad
Osciladores
__________________________________________________________________________________________
DESCARGO DE RESPONSABILIDAD
El trading implica riesgos. Este indicador está destinado únicamente para análisis técnico — siempre aplique una gestión de riesgos adecuada y opere de manera responsable.
COMENTARIOS Y MEJORAS
Si tienes sugerencias, solicitudes de funciones o ideas para mejoras, por favor deja un comentario en la pestaña de Discusión. Tus comentarios ayudan a mejorar el indicador para todos.