Descripción
Conceptos de Dinero Inteligente — visión general de alto nivel
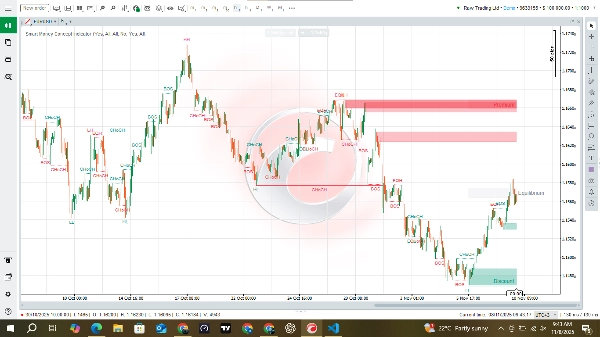
Los Conceptos de Dinero Inteligente visualizan dónde la actividad profesional/institucional probablemente influyó en el precio. Identifica automáticamente la estructura del mercado (estructura oscilante y a corto plazo), resalta rupturas de estructura (BOS) y cambios de carácter (CHoCH), encuentra máximos/mínimos iguales, captura rangos candidatos de bloques de órdenes (áreas donde los grandes jugadores pueden haber colocado órdenes) y pinta zonas contextuales (prima, equilibrio, descuento). Se adapta a la volatilidad del mercado para que sus umbrales escalen con la actividad actual del instrumento.
Lo que los traders obtienen de un vistazo
- Etiquetas claras que muestran cuándo la estructura cambia o se rompe (ayudándote a determinar el sesgo).
- Áreas resaltadas de bloques de órdenes — posibles bolsillos de oferta/demanda donde el precio a menudo se retesta.
- Marcadores de máximos/mínimos iguales — probablemente nodos de liquidez para cacerías de stops o retests.
- Zonas contextuales — prima (caro), equilibrio (valor justo), descuento (barato) — útiles para sesgos y objetivos.
- Máximos y mínimos fuertes/débiles en seguimiento que muestran extremos significativos recientes.
Por qué esto es útil para los traders de SMC
- Acelera la identificación de niveles: dibuja y almacena niveles para que no tengas que buscar manualmente pivotes y bloques de órdenes.
- Consistencia: aplica las mismas reglas para detectar cambios de estructura y candidatos a bloques de órdenes en diferentes instrumentos y marcos temporales.
- Entradas contextuales: muestra dónde puede estar el interés institucional — los traders pueden planificar entradas en retests de esas áreas en lugar de adivinar.
- Enmarcado de riesgo: las zonas y los bordes de los bloques de órdenes ofrecen lugares lógicos para stops y objetivos (por ejemplo, stop más allá de un mínimo/máximo de bloque de órdenes).
- Flujo de trabajo multiescala: usa la estructura a mayor escala para el sesgo y la estructura interna más pequeña para entradas precisas.
Cómo interpretar los elementos principales
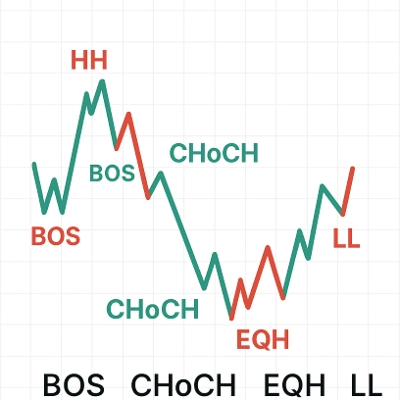
- BOS (Ruptura de Estructura) — señal de continuación en la dirección de la ruptura; útil para confirmar la tendencia.
- CHoCH (Cambio de Carácter) — indicación de que el comportamiento del mercado puede estar cambiando; trátalo como una posible reversión o cambio de sesgo.
- Bloques de Órdenes (OBs) — rangos de precio donde probablemente se acumularon órdenes grandes; espera retests y rechazos allí.
- Máximos/mínimos iguales — niveles repetidos donde se acumula liquidez; a menudo son objetivos antes de grandes movimientos.
- Prima/Equilibrio/Descuento — un mapa de valor simple: la prima favorece a los vendedores, el descuento favorece a los compradores, el equilibrio es neutral/promedio.


