


説明
MARCs Market Overview Lite XAUUSDは、cTrader向けの無料の限定範囲のマーケット概要インジケーターです。
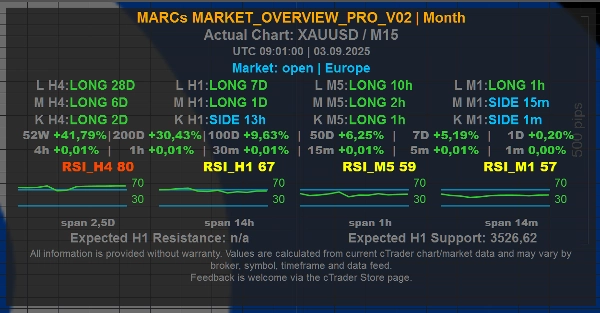
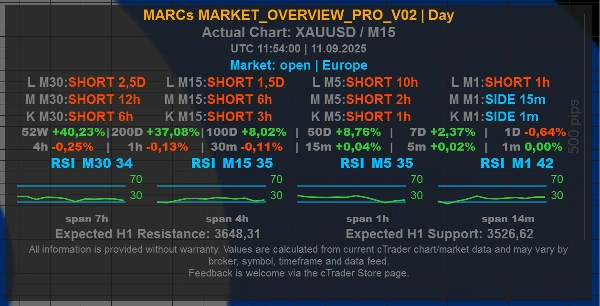
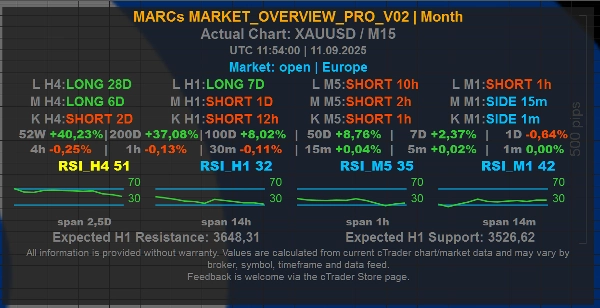
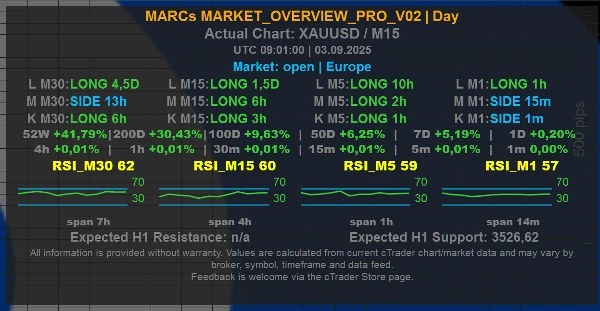
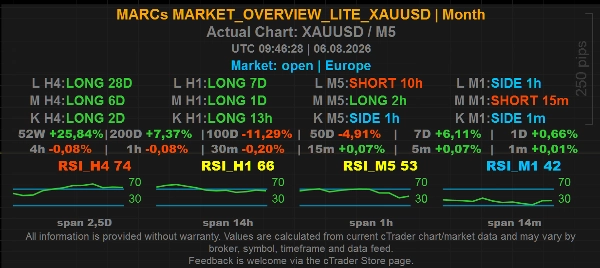
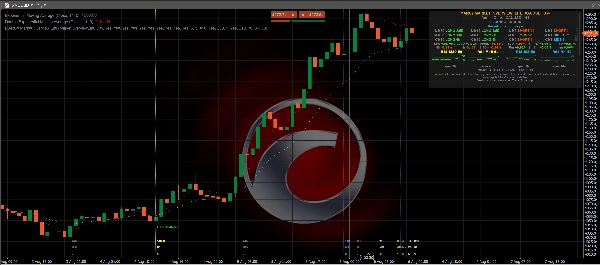
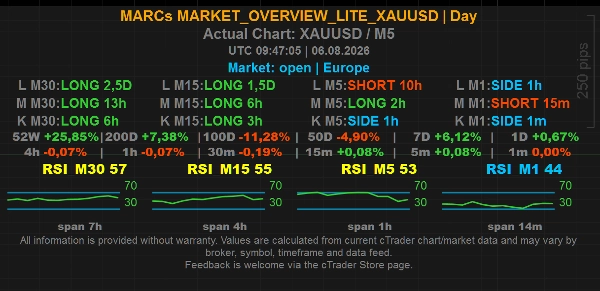
XAUUSD / ゴールドチャート用のコンパクトなオンチャートダッシュボードを表示し、マルチタイムフレームのトレンドコンテキスト、RSIの読み取り、市場/セッション情報、オプションのチャートレベル値、および簡略化された表示コントロールセットを備えています。
このLite版は、XAUUSDの概要ツールとして特化して設計されています。MARCs Market Overviewのコアパネルワークフローを維持しつつ、固定の内部設定と限定されたプリセット選択を使用しています。
主な特徴:
- XAUUSDチャート用の無料Lite版
- コンパクトなオンチャートマーケット概要パネル
- 短期、中期、長期の市場コンテキストのためのマルチタイムフレームトレンド行
- 固定内部タイムフレームにわたるRSI値とミニRSI履歴
- UTC時間の市場/セッションライン
- 日および月のタイムホライズンプリセット
- オプションのマーケットライン
- パネル内に直接表示されるオプションのH1チャートレベル値
- チャート上のオプションの簡略化されたH1レベルライン
- オプションのラインラベル、レベル起点マーカーおよびルックバックマーカー
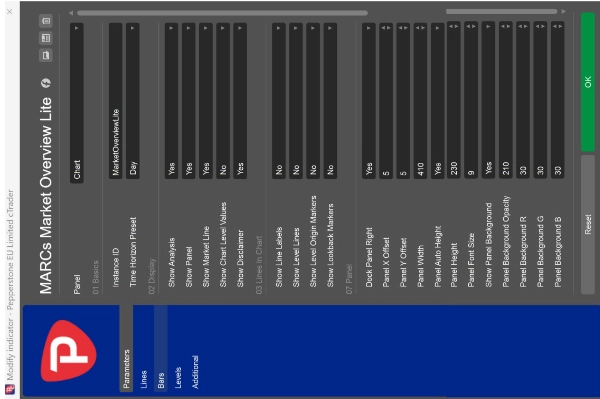
- パネルの位置、幅、高さ、フォントサイズ、背景の外観を完全に調整可能
Lite版の制限:
- XAUUSDチャートのみで動作
- タイムホライズンプリセットは日および月に限定
- トレンド行は固定の内部タイムフレームおよびローソク足設定を使用
- RSI表示は固定の内部設定を使用
- 時間表示は固定の内部設定を使用
- チャートレベル値はH1に限定
- チャートレベルラインは簡略化されたオン/オフオプションとして利用可能で、固定のH1レベルを使用
- Pro版の一部の高度なカスタマイズオプションは含まれていません
インジケーターが他のシンボルにアタッチされている場合、パネルは概要値を表示する代わりにXAUUSD専用の明確な通知を表示します。
レベルラインとチャートレベル値:
オプションの「Show Level Lines」設定は、計算されたH1チャート参照レベルを表示できます。Lite版では、これはオン/オフの簡略化されたオプションです。有効にすると、インジケーターは現在価格の上の最も近い計算されたレジスタンスと、現在価格の下の最も近い計算されたサポートを表示します。
オプションの「Show Chart Level Values」設定は、チャート上にラインを描画せずに、同じ最も近いH1レジスタンス/サポート参照値をパネル内に直接表示できます。パネルのラインには例えば「Chart Levels H1 | R ... | S ...」とラベルが付けられ、値がチャートレベルの参照であることを明確に示します。
レベルラインの計算方法:
レベルは選択された内部タイムフレームの過去のスイングハイとスイングローから導出されます。近接するスイングポイントはレベルクラスターにグループ化され、十分な繰り返し接触がある領域のみが表示されます。これにより、ラインは利用可能なチャート履歴に基づく視覚的な市場コンテキストマーカーとなります。
レベルラインが意味しないこと:
レベルラインは買いシグナル、売りシグナル、ストップロス推奨、利益確定推奨、または投資アドバイスではありません。特定のレベルで価格が反転、ブレイクアウト、反応すると予測するものではありません。
Pro版について:
MARCs Market Overview Proは、より広範なシンボル使用、より多くのタイムホライズンプリセット、およびより詳細なカスタマイズオプションを提供します。Lite XAUUSD版は、よりシンプルなゴールド/XAUUSDマーケット概要パネルを求めるトレーダー向けの無料の特化版です。
重要:
MARCs Market Overview Lite XAUUSDは分析専用のマーケット概要ツールです。取引の実行、ポジション管理、投資アドバイスの提供、取引結果の保証は行いません。
すべての読み取りは利用可能なcTraderチャートデータ、ブローカーのシンボルフィード、タイムフレーム、市場履歴に依存します。値はブローカー、シンボル、データフィードによって異なる場合があります。
取引にはリスクが伴います。過去のパフォーマンスは将来の結果を保証するものではありません。
透明性に関する注意
このインジケーターはAIベースのツールの支援を受けて開発されました。
概要
Level lines are calculated from past swing highs and lows on the H1 timeframe, highlighting key resistance and support clusters based on repeated price touches. These lines serve as visual market context markers but do not constitute trading signals or advice.
The panel’s position, size, font, and background appearance are fully adjustable. The Lite edition uses fixed internal settings and limited presets, restricting its use to XAUUSD charts only. It does not place trades or provide investment recommendations. This tool relies on available chart data and broker feeds, which may vary.
This edition offers a streamlined overview for Gold traders, with broader symbol support and customization available in the Pro version.
ディスカッション
カスタマーレビュー
5 | 0 % | |
4 | 100 % | |
3 | 0 % | |
2 | 0 % | |
1 | 0 % |
よくあるご質問

















価格