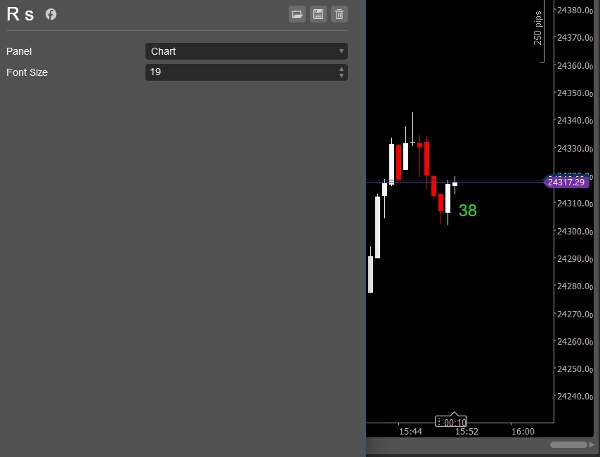
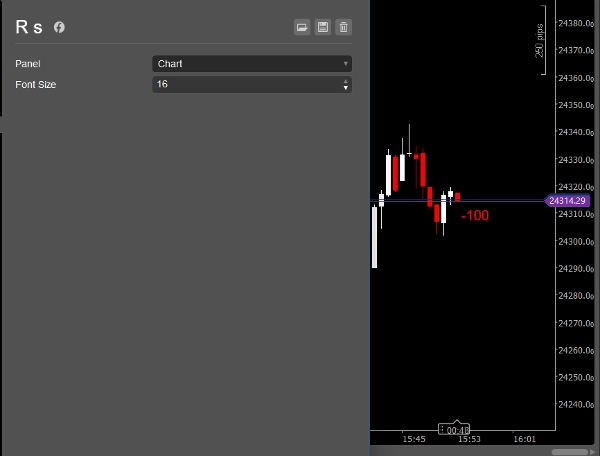
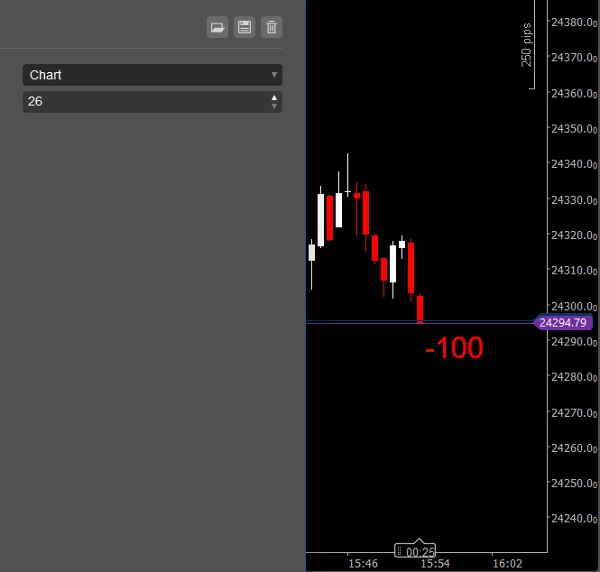
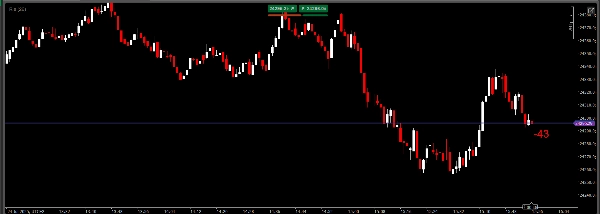
R S
「R S」ロゴ
09/08/2025
25
Desktop
登録日 31/12/2024
販売
3
無料インストール
452
「R S」アップロード画像「R S」アップロード画像「R S」アップロード画像「R S」アップロード画像
  • This indicator is a simple, single-timeframe tool for showing candle sentiment directly on your chart.
    If you want a more advanced, multi-timeframe solution with professional features, check out my other products:
  • Candle Timer & Strength – see candle timers and strength on multiple timeframes, right next to the price.
  • Candle Timer & Strength Panel – always-visible dashboard with timers and candle strength for up to 5 timeframes, fixed at the top of your chart.
  • ZigZag Pro – advanced swing and market structure indicator, perfect for combining with sentiment tools.

Combine Candle Timer & Strength Panel with ZigZag Pro for a complete view of market sentiment, timing, and structure!

Find all my indicators and bots here:
https://ctrader.com/pl?search=kobud.222&u=kobud.222

http://www.youtube.com/@Robi22-22

📩 Questions? Suggestions? Discount?
Contact available in my profile: Robikobud


0.0
レビュー: 0
カスタマーレビュー
この商品にはまだレビューがありません。お使いになったことがある方は、ぜひレビューをお願いします。
この作成者の他の商品
Candle Timer & Strength Demo
Candle Timer & Strength DEMO for cTrader This is a DEMO version of the Candle Timer & Strength indicator. You can use al
Candle Timer & Strength Panel Demo -
Candle Timer & Strength Panel DEMO for cTrader DEMO VERSION – 24 hours free trial! This is a DEMO version of the Candle
ZigZagSmartAlert_demo
ZigZag Smart Alert DEMO for cTrader DEMO VERSION 24 hours free trial! This is a DEMO version of the ZigZag Smart Aler
Zig zag v.1 Demo
ZigZag Pro DEMO – Multi-Swing Indicator for cTrader DEMO VERSION – 24 hours free trial! This is a DEMO version of the Z
Trading_stop Demo
Trading_stop DEMO for cTrader Description: Trading_stop is a fast, lightweight trailing stop panel for cTrader, designed
Trading_stop Plus DEMO
📄 Trading_stop Plus DEMO 🧪 DEMO VERSION – LIMITED TO 48 HOURS This is the demo version of Trading_stop Plus. It works
TraderMaxBBflterXDemo-
TraderMax BB Filter X (DEMO) for cTrader 🧪 Limited-Time Demo Version (24h) TraderMax BB Filter X (DEMO) is a precision
これも好きかも
インジケーター
NAS100
NZDUSD
XAUUSD
+11
TSI True Strength Index
Enhance trading with TSI! Use the True Strength Index for clear insights into market momentum and trend strength.
Bar Explosion
cTrader indicator with mini-timeframe candlesticks. Customize timeframe, colors, margins. Perfect for traders.
インジケーター
Indices
Breakout
Supertrend
[CB] Pivot Points Pro
You can use the cTrader Pivot Points Pro indicator to find a good pullback entry in a trend
インジケーター
Forex
Supertrend
Signal
AlgoCorner 1-100 Moving Averages
Draw as many Moving Averages as you need from a simple indicator.
インジケーター
NAS100
NZDUSD
XAUUSD
+11
Samurai Breakout Lite
⚔️Limited version. Draws clean session box (Tokyo / London / New York / Overlap) and optional breakout plan (EP/TP/SL)⚔️
calculateSpreads_withSourceCode
Indicator calculates spread in pips
Tabajara corrigido[fix]
corrigido todos os bugs e cores invertidas tabajara antigo deleetado
インジケーター
Indices
Forex
Crypto
Super Arrows
Super Arrows
インジケーター
Indices
XAUUSD
Forex
+3
Three Candle Patterns
Spot powerful 3-candle reversal patterns like Morning/Evening Star and Soldiers/Crows at key swing highs and lows
インジケーター
Indices
RSI
Breakout
+6
ZigZagColor
The ZigZag indicator is a technical analysis tool primarily used to identify key price reversal points.
インジケーター
NAS100
NZDUSD
XAUUSD
+15
VWAP_MTF
📊 VWAP with MTF & Dynamic Deviation Bands
3 Bar Triangle by Linda Raschke
3 bar triangle = high below 2 day high, low above 2 day low
インジケーター
Stocks
Forex
Crypto
Quantum Weighted Moving Average (QWMA)
Quantum Weighted Moving Average (QWMA): an advanced moving average that dynamically adjusts weights to market movement
PDHL
PDHL - Previous Day High&Low
インジケーター
NAS100
NZDUSD
Martingale
+26
Support & Resistance Pro
The Support & Resistance Pro helps traders identify key support and resistance levels for informed trading decisions.
NNFX TP AND SL V1.1
A lightweight cTrader indicator that overlays ATR-based SL and TP levels in pips directly on your chart