
supertrend
Indicatore
5 acquisti
Versione 1.0, May 2025
Windows, Mac
4.3
Recensioni: 3
Descrizione
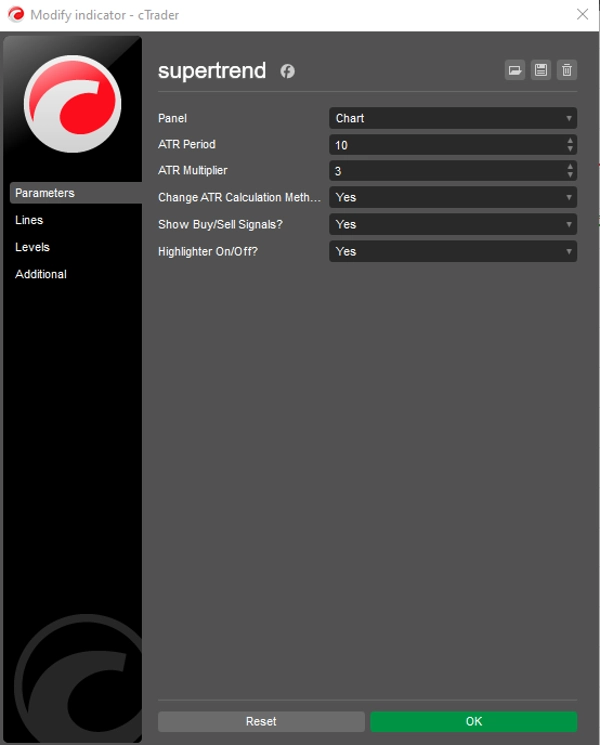
Indicatore Supertrend per cTrader
L'indicatore Supertrend è uno strumento potente e versatile per seguire le tendenze, progettato per aiutare i trader a identificare facilmente le tendenze di mercato e i potenziali punti di ingresso/uscita. Realizzato per la piattaforma cTrader, questo indicatore utilizza l'Average True Range (ATR) per calcolare livelli dinamici di supporto e resistenza, fornendo segnali visivi chiari per tendenze rialziste e ribassiste. La sua semplicità ed efficacia lo rendono un favorito tra i trader di tutti i livelli di esperienza, dagli scalper agli investitori a lungo termine.
Riepilogo
Riepilogo AI
The Supertrend Indicator for cTrader is a trend-following tool that helps traders identify market trends and potential entry and exit points. It uses the Average True Range (ATR) to calculate dynamic support and resistance levels, providing clear visual signals for bullish and bearish trends. Designed for use on the cTrader platform, this indicator supports markets including Forex and indices. Its straightforward design makes it suitable for traders of various styles and experience levels, from scalpers to long-term investors. The indicator outputs trend strength signals based on bar data, aiding in market analysis without opening positions automatically.
Profilo indicatore
Categoria indicatore
Trend
Tipo di output
Segnali
Requisiti per i dati
Solo barre
Segnali supportati
Forza del trend
Recensioni dei clienti
4.3
Recensioni: 3
5 | 67 % | |
4 | 0 % | |
3 | 33 % | |
2 | 0 % | |
1 | 0 % |
Recensioni dei clienti
June 3, 2025
Practical entry check for traders who prefer directional setups. It gives value around trend filtering, but sideways markets can weaken the signal. The signal feels safer when trend strength is clear and DD stays under 3 percent. It is a filter for bias, not a reason to ignore risk.
June 2, 2025
June 2, 2025
Clean confirmation helper for trend filtering. it helps keep attention on the broader move, especially when used for filtering out random countertrend ideas. I would judge the trend read across 3 sessions, with at least 2 higher timeframe candles agreeing. It is a filter for bias, not a reason to ignore risk.
Discussioni
Domande frequenti
Prop
Forex
Signal
Indices
Supertrend
ATR
I prodotti disponibili tramite cTrader Store, inclusi bot di trading, indicatori e plugin, sono forniti da sviluppatori terzi e resi disponibili esclusivamente a scopo informativo e di accesso tecnico. cTrader Store non è un broker e non fornisce consulenze in materia di investimento, raccomandazioni individualizzate o garanzie di risultati futuri.


![Logo di "Gaussian Channel [Iridio Capital]"](https://cdn.ctrader.com/image/webp/7c039209-5573-4a54-a072-f9528b503103_41960)


Prezzo
Da 30/05/2025
40
Vendite