
คำอธิบาย
Index Hunter: ภาพรวม
Index Hunter เป็นตัวชี้วัดทางเทคนิคเฉพาะทางและระบบสนับสนุนการตัดสินใจที่ออกแบบมาโดยเฉพาะสำหรับดัชนีที่มีความผันผวนสูง เช่น US30 (Dow Jones) และ NAS100 (Nasdaq) แตกต่างจากตัวชี้วัดมาตรฐานที่แสดงเพียงข้อมูลในอดีต Index Hunter มุ่งเน้นที่ "การทำนายเวกเตอร์"—พยายามทำนายว่าราคาน่าจะอยู่ที่ใดในอีก 4 แท่งเทียนข้างหน้าโดยอิงจากความเร็วปัจจุบัน (ความชัน) ในหลายกรอบเวลา
1. กลไกหลัก (วิธีการทำงาน)
A. เครื่องยนต์พยากรณ์ "เวกเตอร์"
นี่คือหัวใจของเครื่องมือ มันไม่ได้ดูแค่ราคาปัจจุบันเท่านั้น แต่คำนวณ อัตราการเปลี่ยนแปลง (ความชัน) ในกรอบเวลา M5, M15 และ H1 เพื่อวาด "เส้นทางอนาคต" บนกราฟของคุณ
- กลไก: มันคำนวณค่าเฉลี่ยถ่วงน้ำหนักของโมเมนตัมจากกรอบเวลาต่างๆ เพื่อทำนาย 4 จุด (P1, P2, P3, P4) ในอนาคต
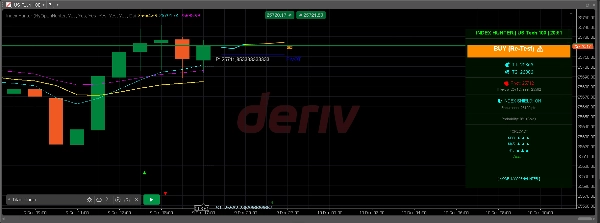
- ภาพประกอบ: คุณจะเห็นเส้นทางสี (ฟ้า -> เหลือง -> ส้ม) ขยายไปทางขวาของราคา แสดงถึงแรงเฉื่อยของตลาด
- เส้นทางผี: มันยังจำ การทำนายก่อนหน้า (เส้นทางผี) เพื่อให้คุณเห็นว่าตลาดเคารพการทำนายในอดีตของอัลกอริทึมหรือไม่ (เป็นการ "ตรวจสอบความเป็นจริง")
B. ระบบภาพหลายชั้น
มันซ้อนทับระดับสถาบันสำคัญโดยอัตโนมัติ:
- จุดหมุน (ยืดหยุ่น): คำนวณจุดหมุน, R1/S1 และ R2/S2 โดยอัตโนมัติตามกรอบเวลาที่เลือกได้ (H12, รายวัน, วัน2 หรือ วัน3)
- ระดับจิตวิทยา: วาด "เส้นจิตวิทยา" ทุกช่วง 100 จุด (เช่น 34000, 34100) ซึ่งมักทำหน้าที่เป็นโซนแม่เหล็กสำหรับดัชนี
- สูง/ต่ำ รายวัน: แสดงช่วงของวันก่อนหน้าเพื่อแสดงโซนเบรกเอาท์หรือปฏิเสธ
- แฟรคทัล: ระบุจุดสูงสุดและต่ำสุดในท้องถิ่นด้วยลูกศร (▲ ▼) เพื่อการวางจุดเข้า/หยุดขาดทุนอย่างแม่นยำ
C. ตรรกะ "ความมั่นใจ" และความเป็นไปได้
เครื่องมือนี้ไม่ได้ให้สัญญาณเพียงอย่างเดียว แต่ยังให้คะแนนด้วย
- การคำนวณ: มันวัดระยะทางไปยังเป้าหมายกำไรของคุณและเปรียบเทียบกับพลังงานปัจจุบันของตลาด (ATR - ช่วงจริงเฉลี่ย)
- ผลลัพธ์:
-
- ร้อน (>80%): โมเมนตัมแข็งแกร่ง + ระยะทางเป้าหมายเหมาะสม
- อุ่น (50-80%): การตั้งค่าปานกลาง
- เย็น (<50%): ตลาดถือว่ามีโอกาสต่ำที่จะถึงเป้าหมาย (เช่น เป้าหมายไกลเกินไปสำหรับความผันผวนปัจจุบัน)
D. กลไก "โล่" บัญชี
มันรวมผู้จัดการความเสี่ยงแบบพาสซีฟไว้บนแผงควบคุม:
- ตัวชี้วัดความทนทาน: คำนวณจำนวน "จุด" ที่ตลาดสามารถเคลื่อนไหวสวนทางกับคุณก่อนที่บัญชีของคุณจะตกอยู่ในอันตราย โดยอิงจากยอดเงินและขนาดล็อตขั้นต่ำของคุณ
- สถานะ: แสดง "🛡️ INDEX SHIELD: ON" หากบัญชีของคุณปลอดภัยเมื่อเทียบกับความผันผวนปัจจุบัน (ATR) หรือ "⚠️ LOW MARGIN" หากความผันผวนสูงเกินไปสำหรับยอดเงินของคุณ
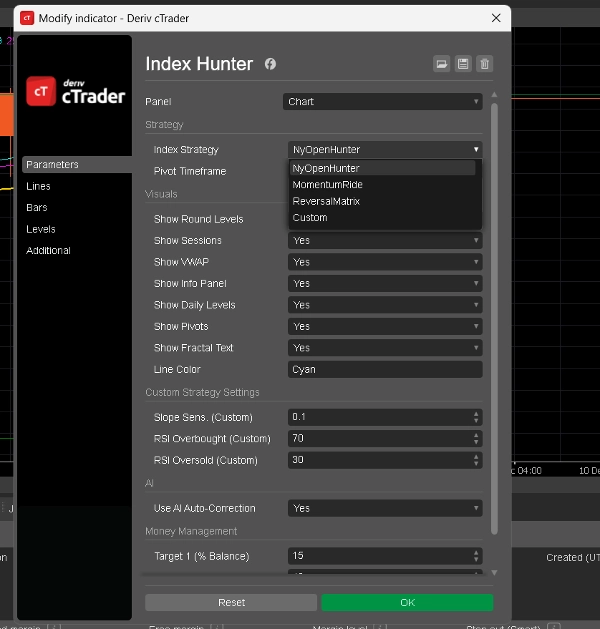
2. โหมดที่มีให้ใช้งาน (กลยุทธ์)
คุณสามารถสลับระหว่างโหมดเหล่านี้ได้ในการตั้งค่าตัวชี้วัด (
Index Strategy
พารามิเตอร์) แต่ละโหมดจะเปลี่ยนวิธีที่ AI แปลความหมายตลาด
1. โหมด: NyOpenHunter (นักเก็งกำไรนิวยอร์ก)
- เหมาะสำหรับ: ช่วง 2-3 ชั่วโมงแรกที่วุ่นวายของการเปิดตลาดสหรัฐ
- ตรรกะ:
-
- เวลาทำงาน: 13:00 - 17:00 UTC (โดยประมาณ)
- ทริกเกอร์: มันมองหาความชัน M5 ที่มากกว่า 0.1 (หรือ น้อยกว่า -0.1)
- ปรัชญา: "จับการระเบิด" มันรอสัญญาณปริมาณเริ่มต้นที่ระฆังนิวยอร์กและส่งสัญญาณให้ขี่คลื่นนั้น
- ความรู้สึกของแผงควบคุม: แสดง "NY OPEN BUY 🚀" หรือ "NY OPEN SELL 🔻"
2. โหมด: MomentumRide (ผู้ติดตามแนวโน้ม)
- เหมาะสำหรับ: แนวโน้มที่แข็งแกร่งและต่อเนื่องนอกช่วงเปิดตลาด
- ตรรกะ:
-
- ทริกเกอร์: ต้องการความชัน M5 ที่ แข็งแกร่งกว่า (> 0.2) กว่าโหมด NY
- ปรัชญา: "อย่าให้ถูกสับ" มันมองข้ามการเคลื่อนไหวที่อ่อนแอและส่งสัญญาณเฉพาะเมื่อตลาดเคลื่อนไหวด้วยความมั่นใจอย่างมาก
- ความรู้สึกของแผงควบคุม: แสดง "MOMENTUM UP 🟢" หรือ "MOMENTUM DOWN 🔴"
3. โหมด: ReversalMatrix (สวนทางแนวโน้ม)
- เหมาะสำหรับ: ตลาดที่เคลื่อนไหวในกรอบหรือจับจุดสูงสุด/ต่ำสุด
- ตรรกะ:
-
- ทริกเกอร์: ใช้ RSI (ดัชนีความแข็งแกร่งสัมพัทธ์)
-
- สัญญาณขาย: RSI > 75 (ซื้อมากเกินไป)
- สัญญาณซื้อ: RSI < 25 (ขายมากเกินไป)
- ปรัชญา: "ต้านทานความสุดโต่ง" มันระบุเมื่อแถวยางถูกดึงเกินไปและมีแนวโน้มจะดีดกลับ
- ความรู้สึกของแผงควบคุม: "ซื้อมากเกินไป (ขายเร็วๆ นี้)" หรือ "ขายมากเกินไป (ซื้อเร็วๆ นี้)"
4. โหมด: กำหนดเอง (ผู้ใช้กำหนด)
- เหมาะสำหรับ: ผู้ใช้ขั้นสูงที่ต้องการปรับแต่งบอท
- ตรรกะ: อนุญาตให้คุณตั้งค่าขีดจำกัดของ ความไวความชัน และ ระดับ RSI ในตั้งค่า
-
- ตัวอย่าง: คุณสามารถสร้างกลยุทธ์ผสมที่ซื้อเฉพาะเมื่อความชัน > 0.05 และ RSI < 40
3. "แผงข้อมูล" (หน้าจอแสดงผล)
แผงภาพทางด้านขวาของกราฟรวบรวมข้อมูลทั้งหมดนี้ไว้ด้วยกัน:
- หัวข้อ: แสดงโหมดและสัญลักษณ์ปัจจุบัน
- ความชอบ: แนวโน้มหลักของ AI (เช่น "BUY 34150 ▲")
- เป้าหมาย (T1, T2): เป้าหมายกำไรแบบไดนามิกที่คำนวณตามเปอร์เซ็นต์บัญชีและความผันผวนของคุณ
- การพยากรณ์: การวิเคราะห์ลำดับของแนวโน้ม M30, M45 และ H1 (เช่น "M30: ▲ ▲ ▲" หมายถึงการซื้อที่แข็งแกร่ง)
- ความน่าจะเป็น: คะแนนความมั่นใจของ AI (ร้อน/อุ่น/เย็น)
สรุป
Key features include an automatic overlay of institutional levels such as pivot points (with selectable timeframes), psychological price levels at 100-point intervals, previous day’s high/low, and fractals marking local tops and bottoms. It incorporates a confidence grading system (Hot, Warm, Cold) based on momentum strength and volatility relative to profit target distance.
Index Hunter includes a risk management "Shield" that assesses account safety by calculating potential adverse market moves against account balance and lot size, displaying status alerts accordingly.
The indicator offers four operational modes: NyOpenHunter (New York market open scalping), MomentumRide (trend following), ReversalMatrix (counter-trend using RSI), and a Custom mode for user-defined slope and RSI thresholds. A comprehensive info panel consolidates mode, bias, dynamic targets, trend forecasts, and confidence scores for decision support.
รีวิวจากลูกค้า
5 | 67 % | |
4 | 33 % | |
3 | 0 % | |
2 | 0 % | |
1 | 0 % |


!["[Hamster-Coder] Bollinger Bands" โลโก้](https://cdn.ctrader.com/image/webp/21d8e5d6-fb11-4bac-b9ee-cd05c2b76804_30327)


