Descrizione
🔥 Pinescritlabs
Indicatori Ctrader Store: 🤖Pinescritlabs Ctrader Store cBots:
Fair Value Gap Sessions Gold & BTC Breakout Session Pivots
Dynamic Market Structure
Analisi dei Punti di Svolta
Fibonacci Linear
Regressione Multi-timeframe
Multi-Level Candle Bias
Tracker
Auto Support and
Resistance Trend Lines
All Support and
Resistance Levels
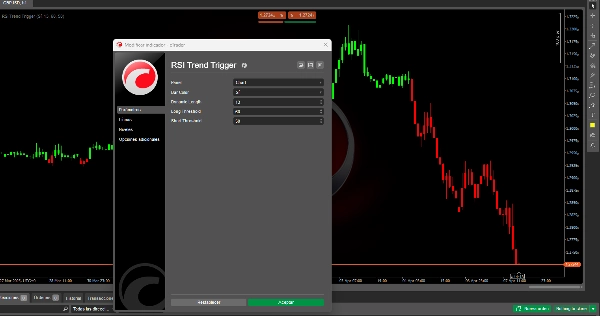
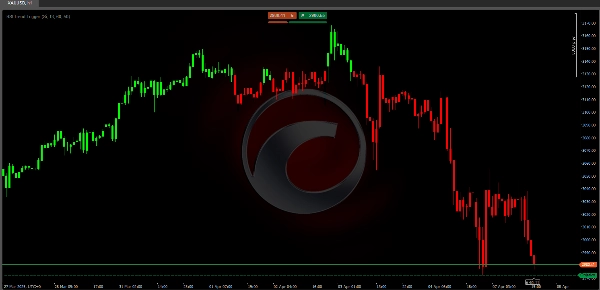
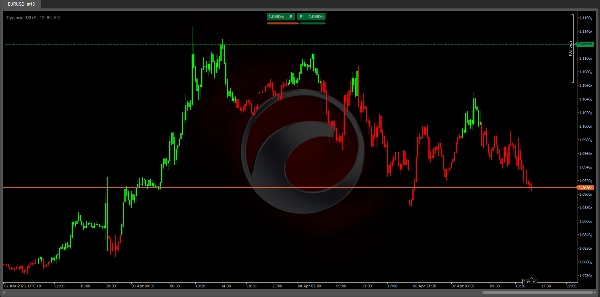
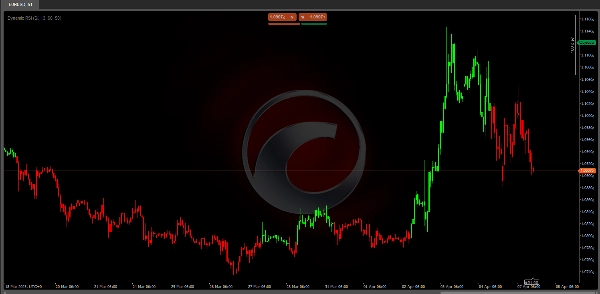
RSI Trend Trigger 📈✨
Come Funziona? 🤔
Passo 1: RSI Tradizionale
L’Indice di Forza Relativa (RSI) standard viene calcolato, misurando la velocità e l’entità dei movimenti di prezzo in un periodo definito. Oscilla tra 0 e 100, identificando condizioni di ipercomprato (es. sopra 70) e ipervenduto (es. sotto 30). 📊📉📈
Passo 2: Raffinamento Dinamico
L’RSI tradizionale subisce un processo avanzato di levigatura:
- Viene applicato un secondo calcolo matematico ai valori originali dell’RSI (non al prezzo stesso).
- Questo passaggio crea una versione più stabile dell’RSI, riducendo le fluttuazioni minori (rumore di mercato) e mettendo in evidenza le tendenze genuine.
- A differenza della levigatura base, questo metodo preserva la reattività ai cambiamenti significativi di momentum, evitando ritardi eccessivi. 🛡️🔄
Perché il Raffinamento è Importante? 🤩
- Filtraggio Intelligente: Elimina falsi segnali causati da volatilità temporanea, come picchi dovuti a notizie o mosse speculative. �🗑️
- Tendenze Più Chiare: L’approccio a doppio calcolo distingue tra correzioni minori e vere inversioni di tendenza. 🎯
- Segnali Persistenti: Una volta confermata una tendenza (rialzista/ribassista), l’indicatore la mantiene fino a un’inversione chiara, evitando salti erratici di segnale. 🔒
Uso Pratico: Soglie e Decisioni 📈
L’RSI raffinato si combina con due soglie regolabili:
- Soglia Rialzista (es. 60):
-
- Se l’RSI raffinato supera questo livello, si conferma una tendenza rialzista. 🚀
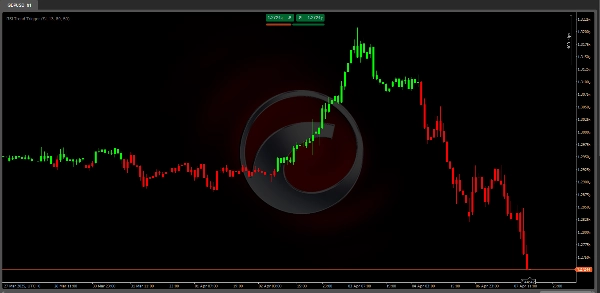
- Le candele diventano verdi
- Soglia Ribassista (es. 50):
-
- Se l’RSI raffinato scende sotto questo livello, si attiva una tendenza ribassista. 📉
- Le candele diventano rosse
Regola Chiave:
- I segnali appaiono solo durante i cambi di tendenza (non ad ogni fluttuazione), riducendo il sovraccarico informativo. 🚫📢
- Le soglie sono personalizzabili: usa valori più alti (es. 65/55) per mercati volatili o valori più bassi (es. 55/45) per tendenze più fluide. ⚙️
Vantaggi per i Trader 🏆
- Precisione Migliorata:
-
- Meno falsi segnali grazie al filtraggio a doppio strato. Ideale per mercati laterali o falsi segnali. ✅
- Visualizzazione Intuitiva:
-
- Candele colorate e soglie visive permettono di individuare le tendenze all’istante. 👀🎨
- Adattabilità:
-
- Funziona su diversi asset (forex, azioni, crypto) e timeframe (minuti a settimane). 🌍⏳
- Trading Focalizzato sulla Tendenza:
-
- Aiuta a seguire il momentum, evitando mosse contro-tendenza rischiose. 🎯🚦
Esempio di Flusso di Segnali
Immagina che l’RSI raffinato sia a 55 (zona neutra):
- Scenario Rialzista: Sale a 62 → Supera la soglia 60 → Le candele diventano verdi🚀
- Scenario Ribassista: Scende a 48 → Scende sotto la soglia 50 → Le candele diventano rosse📉
Riepilogo
The indicator then applies an advanced smoothing process to the RSI values, not the price data, creating a refined RSI that reduces minor market noise while maintaining sensitivity to significant momentum changes. This dual-layer calculation enhances signal precision by filtering out false signals caused by temporary volatility and distinguishing between minor corrections and genuine trend reversals.
Users can customize two threshold levels—a bullish threshold (e.g., 60) and a bearish threshold (e.g., 50)—to define when a trend is confirmed. When the refined RSI crosses above the bullish threshold, the indicator signals a bullish trend with green candles; when it falls below the bearish threshold, it signals a bearish trend with red candles. Signals appear only during trend changes, reducing information overload.
The RSI Trend Trigger supports multiple timeframes from minutes to weeks and is adaptable to different market conditions, aiding traders in aligning with momentum and avoiding counter-trend risks.
Recensioni dei clienti
5 | 67 % | |
4 | 33 % | |
3 | 0 % | |
2 | 0 % | |
1 | 0 % |