
RegressionChannelV2
Wskaźnik
Wersja 1.0, Jan 2026
Windows, Mac
4.6
Opinie: 3
Od 31/01/2025
451.42M
Wolumen transakcji
2.78M
Zysk w pipsach
4
Sprzedaż
187
Bezpłatne instalacje
Opis
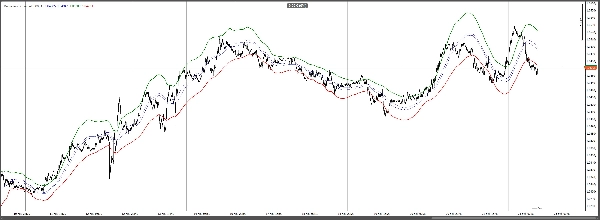
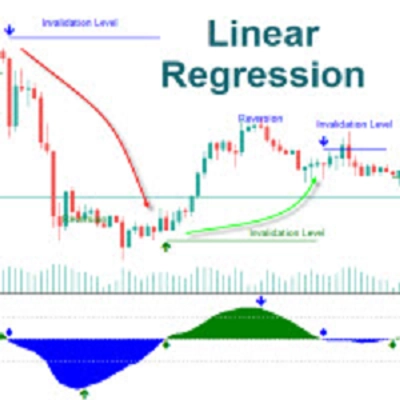
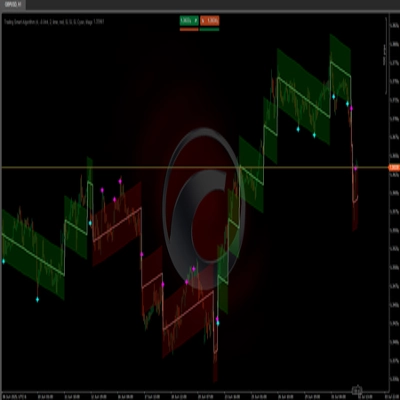
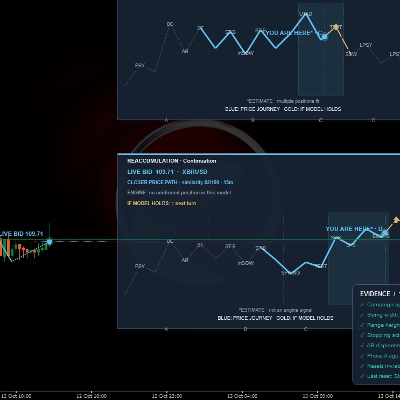
Regression Channel to wizualne narzędzie do analizy trendu i zmienności, które rysuje gładki kanał wokół ceny. Oblicza adaptacyjne górne i dolne granice na podstawie ostatnich zachowań rynku, pomagając szybko zidentyfikować dominujący kierunek, zmierzyć rozszerzenie/kurczenie zmienności oraz wykryć potencjalne nadmierne ruchy.
Użyj go do:
- Potwierdzenia kierunku i siły trendu
- Wyróżniania stref powrotu do średniej w pobliżu krawędzi kanału
- Wykrywania wybicia, gdy cena przekracza granicę
- Ulepszania wejść/wyjść poprzez łączenie z istniejącymi sygnałami
Parametry:
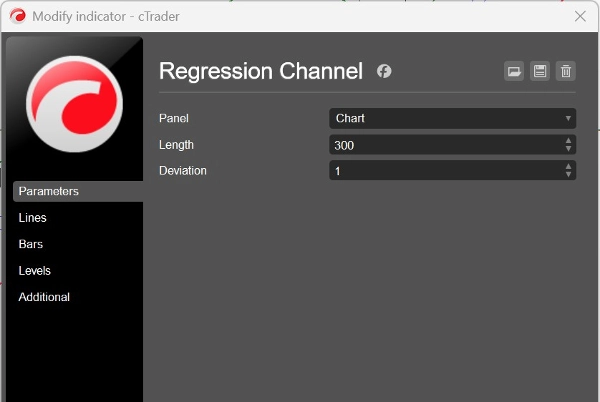
- Length: okno retrospektywne używane do obliczania kanału
- Deviation: mnożnik szerokości pasma kontrolujący, jak wąski lub szeroki jest kanał
Podsumowanie
Podsumowanie AI
RegressionChannelV2 is a technical indicator that plots dynamic upper and lower bands around price to visualize trend direction and volatility. It calculates adaptive boundaries based on recent market data, forming a smooth channel that helps identify the prevailing trend, measure volatility changes, and detect potential overextended price moves. Key uses include confirming trend strength, highlighting mean-reversion zones near channel edges, spotting breakouts when price moves beyond the channel, and enhancing trade entries and exits when combined with other signals. The indicator’s parameters include Length, which sets the lookback window for channel calculation, and Deviation, which adjusts the channel width by controlling band tightness. It supports various markets and symbols such as Forex (EURUSD, GBPUSD, NZDUSD, USDJPY), cryptocurrencies (BTCUSD, crypto), commodities (XAUUSD, gold, oil), indices (NAS100, SP500, DAX), and stocks. This tool is suitable for traders seeking visual trend and volatility analysis across multiple asset classes.
Profil wskaźnika
Dyskusja
Opinie klientów
4.6
Opinie: 3
5 | 67 % | |
4 | 33 % | |
3 | 0 % | |
2 | 0 % | |
1 | 0 % |
Opinie klientów
January 24, 2026
Messy entries become more obvious, but the market context still matters.
January 23, 2026
direction is easier to respect, but the trade log should confirm the value.
January 19, 2026
The setup is easier to scan, but messy settings can create bad signals.
Częste pytania
BTCUSD
Forex
Signal
Breakout
Indices
EURUSD
Commodities
GBPUSD
NZDUSD
Prop
Scalping
Crypto
Stocks
XAUUSD
NAS100
USDJPY
Produkty dostępne za pośrednictwem cTrader Store, w tym boty handlowe, wskaźniki i wtyczki, dostarczane są przez deweloperów zewnętrznych i udostępniane wyłącznie w celach informacyjnych oraz w celu zapewnienia dostępu technicznego. cTrader Store nie jest brokerem i nie zapewnia doradztwa inwestycyjnego, nie udziela spersonalizowanych rekomendacji ani nie gwarantuje przyszłych wyników.







Cena
Od 31/01/2025
451.42M
Wolumen transakcji
2.78M
Zysk w pipsach
4
Sprzedaż
187
Bezpłatne instalacje