present
Registrieren Sie sich und erhalten Sie $50 Rabatt auf Ihren ersten Kauf
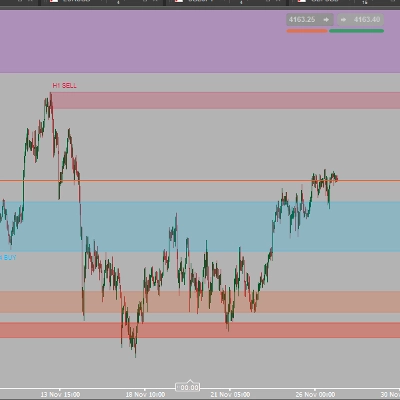
Trading product for ICT PO3 AMD Indikator SMA Market Structure, image 1
ICT PO3 AMD
Indikator
74 downloads
Version 1.0, Apr 2026
Windows, Mac
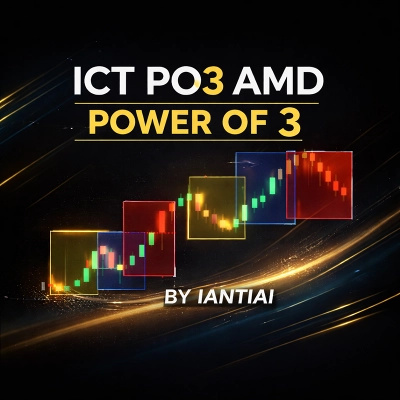
Trading product for ICT PO3 AMD Indikator SMA Market Structure, image 2
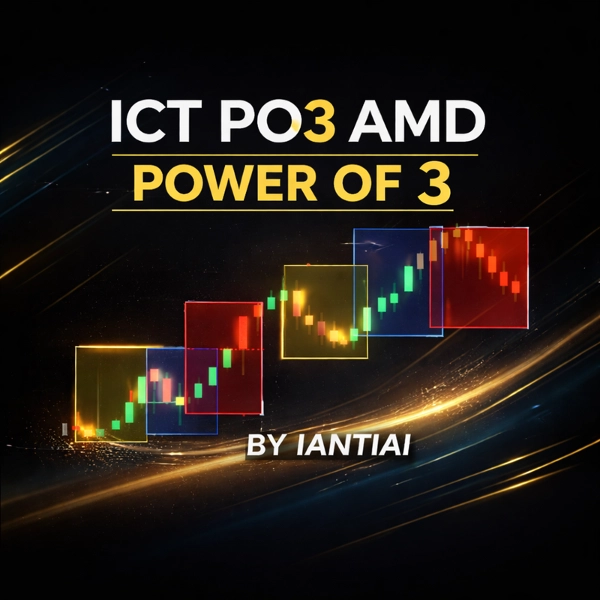
Trading product for ICT PO3 AMD Indikator SMA Market Structure, image 3
51
Verkäufe
1.43K
Kostenlose Installationen

Beschreibung

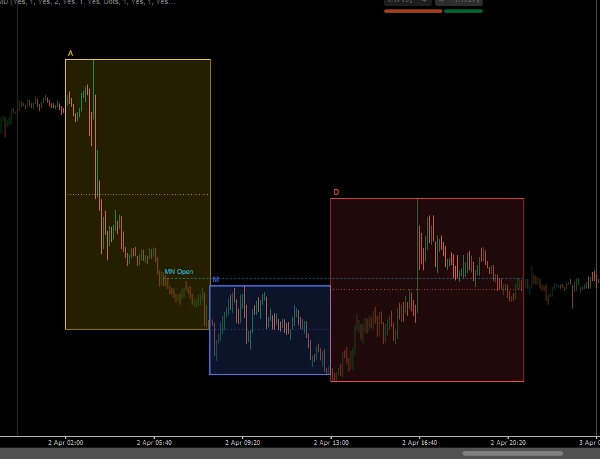
ICT PO3 AMD von IANTIAI basiert auf dem ursprünglichen ICT Power of 3 Konzept und hilft Händlern, die drei Hauptmarktphasen zu identifizieren: Akkumulation, Manipulation und Distribution.

Es ist für die Echtzeitanalyse der New Yorker Sitzung konzipiert und beinhaltet die New York Midnight Open als wichtigen Referenzpunkt. Der Indikator bietet eine klare visuelle Struktur direkt im Chart, was es erleichtert, das Sitzungsverhalten zu verfolgen und zu verstehen, wie sich der Preis durch den AMD-Zyklus entwickelt.

Dieses Tool ist für Händler gemacht, die eine klarere Sicht auf die Marktstruktur, mögliche Manipulationen und den allgemeinen Sitzungsverlauf wünschen. Es eignet sich für ICT-Händler, Intraday-Händler und alle, die sich auf die Logik der New Yorker Sitzung konzentrieren.

Hinweis: Dieser Indikator dient nur zur Chartanalyse und Entscheidungsunterstützung. Er führt keine automatischen Trades aus und garantiert keine Gewinne.

ICT PO3 AMD von IANTIAI basiert auf dem ursprünglichen ICT Power of 3 Konzept und hebt die drei wichtigsten Marktphasen hervor: Akkumulation, Manipulation und Distribution.

Zusammenfassung

AI summary
ICT PO3 AMD is a market structure indicator based on the ICT Power of 3 concept, designed to identify three key market phases: Accumulation, Manipulation, and Distribution. It focuses on real-time analysis of the New York trading session, incorporating the New York Midnight Open as a critical reference level. The indicator visually overlays these phases directly on the price chart, providing traders with a clear framework to observe session behavior and price development through the AMD cycle. It is intended for traders interested in understanding market structure and session flow, particularly those using ICT methodologies or trading intraday during the New York session. This tool supports analysis and decision-making but does not execute trades automatically. It is compatible with bar and tick data and provides visual signals related to trend strength and session open range.

Indikatorprofil
Indikatorkategorie
Marktstruktur (SMC)
Ausgabetyp
Visualisierung
Datenanforderungen
Nur Balken
Tick-Daten
Unterstützte Signale
Trendstärke
Eröffnungsspanne der Sitzung

Kundenbewertungen

0.0
Bewertungen: 0
Kundenbewertungen
Bisher gibt es keine Bewertungen für dieses Produkt. Haben Sie es schon ausprobiert? Dann können Sie die erste Person sein, die andere darüber informiert!

Diskussion

Häufig gestellte Fragen (FAQ)

SMA
Market Structure
Über den cTrader Store verfügbare Produkte, einschließlich Handelsbots, Indikatoren und Plugins, werden von externen Entwicklern bereitgestellt und nur zu Informations- und technischen Zugriffszwecken verfügbar gemacht. cTrader Store ist kein Broker und erbringt keine Anlageberatung, persönlichen Empfehlungen oder eine Garantie für zukünftige Performance.

Mehr von diesem Autor

Indikator
Forex
Signal
Market Session BT
Indikator
Prop
Forex
+5
Half Trend – Trend Reversal Indicator for cTrader
Indikator
Prop
Forex
+4
Camarilla — a precise, non-repainting pivot indicator for cTrader.
Indikator
Prop
Forex
+12
Half Trend Cloud
Indikator
Prop
Forex
+4
Bar Time Timeframe / Renko
Indikator
Prop
Forex
+4
HMA MTF 2.0 (Multi-Timeframe )
Indikator
Forex
BTCUSD
+10
Belkhayate PRC (Polynomial Regression Channel)
Indikator
Prop
Forex
+3
Price Change Bundle 3-in-1 Levels • Bars • Histogram. Secret of Price Change
Indikator
Key Levels
Supply & Demand
IANTIAI Season Pro – know when the market usually moves
Indikator
Prop
Forex
+5
Price Level DWM BT
Indikator
Prop
Forex
+1
DXY Valuation Zones
cBot
AI Trading
AI Integration
Export cTrader market data to CSV or JSON for Python, AI, backtesting and quantitative research.

Das könnte Sie auch noch interessieren

Indikator
Prop
VWAP
+5
VWAP is a powerful tool for intraday traders
Indikator
Volume
Key Levels
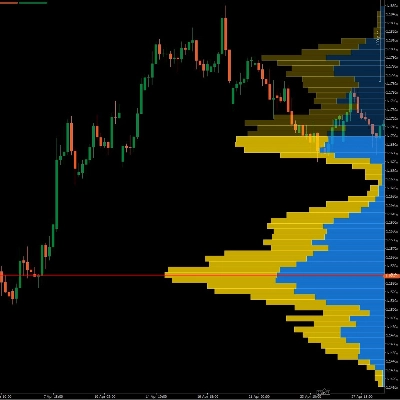
Dynamic Visible Range Volume Profile for cTrader. Real-time POC, Value Area & Smart Alerts for precise trading.
Indikator
BOS
Add standard-timeframe context candles to a native Renko chart.
„KANDIKA HEAT MAP“-Logo
Beste Ratings
4.6
(5)
$19
Indikator
Color-Based Market Pressure & Volatility Visualizer The Kandika Heatmap Indicator
Indikator
MSS
Volume
+3
Rejection-based volume profile with tiered heat zones, POC levels and a fully draggable anchor on cTrader.
Indikator
ADX
ATR
+2
GOLD SENTINEL v1.0 - A CANDLE-COLORING INDICATOR FOR GOLD.
Indikator
ADX
ATR
+3
Get complete access to HAI Quantum V7 trial
Indikator
AI
ATR
+27
Support and Resistance with signals
Indikator
AI
ATR
+27
🔮 Smart Bar Predictor - Professional Volatility Forecasting Indicator
Indikator
Forex
Indices
+1
Professional Fair Value Gaps with multitimeframe spot on
Indikator
Drawdown Monitor
Protect your funded account. Real-time Daily Equity Drawdown monitor with Green / Orange / Red flashing alerts.
Indikator
ADX
ATR
+5
Precision Sniper by PrimeQuant: Advanced confluence engine with auto-presets, dynamic TP/SL, and live backtest stats.
Indikator
Prop
Forex
+11
🧭 See when your market tends to move—by Month, Day-of-Week, or Hour-of-Day🧭
Indikator
Forex
Crypto
+5
The Woodie CCI Indicator (Woodie Commodity Channel Index) is a variation of the classic CCI indicator
Indikator
RSI
SMC
+17
RSI, MACD, Stochastic, CCI & Momentum divergence scanner with confluence scoring. Never miss a signal again!
Indikator
RSI
Forex
+12
Indicator pattern signal moment
Indikator
ATR
RSI
+14
A metric that can set 1 to 3 groups of Bollinger Bands
Indikator
Prop
Forex
+10
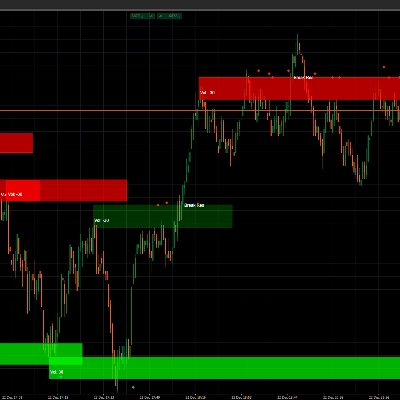
Heatmap Pro analiza la volatilidad, el volumen y la acción del precio para "pintar" tu gráfico con zonas de color.

Preis

51
Verkäufe
1.43K
Kostenlose Installationen