
present
Zarejestruj się i otrzymaj 50 $ zniżki na pierwszy zakup
Trading product for Fibonacci Automated Level Wskaźnik Signal Indices, image 1
Fibonacci Automated Level
Wskaźnik
1 zakupy
Wersja 1.0, Apr 2026
Windows, Mac
4.0
Opinie: 3
Trading product for Fibonacci Automated Level Wskaźnik Signal Indices, image 2
Trading product for Fibonacci Automated Level Wskaźnik Signal Indices, image 3
Trading product for Fibonacci Automated Level Wskaźnik Signal Indices, image 4
Trading product for Fibonacci Automated Level Wskaźnik Signal Indices, image 5
Trading product for Fibonacci Automated Level Wskaźnik Signal Indices, image 6
Od 29/05/2025
3.04M
Wolumen transakcji
45.22K
Zysk w pipsach
29
Sprzedaż
810
Bezpłatne instalacje

Opis

📊 Wskaźnik Automatycznych Poziomów Fibonacciego (BOSSFXTRADER v1.0)

🔍 Opis

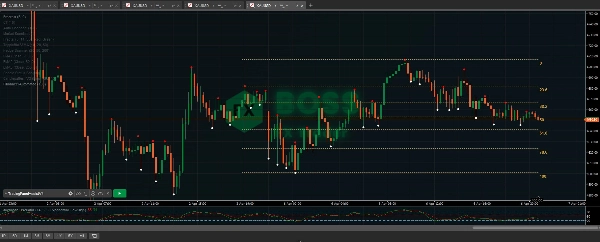
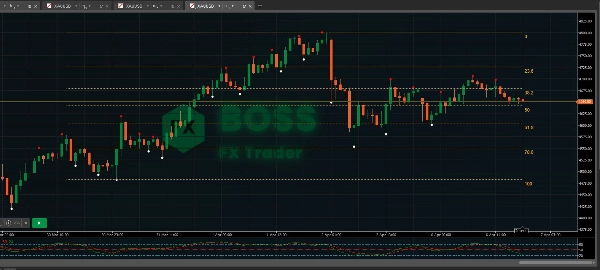
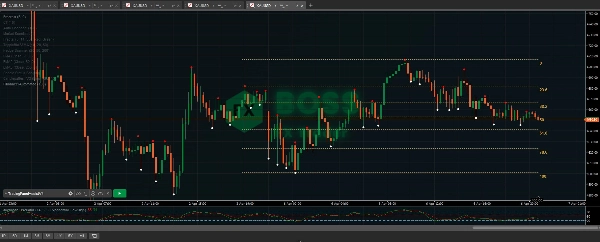
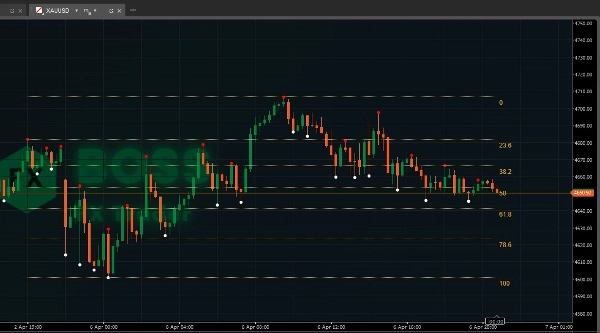
Wskaźnik Automatycznych Poziomów Fibonacciego to inteligentne narzędzie handlowe, które automatycznie wykrywa najnowszy ruch rynkowy (maksimum i minimum) w określonym okresie analizy i rysuje kluczowe poziomy zniesienia Fibonacciego bezpośrednio na Twoim wykresie.

W przeciwieństwie do ręcznego rysowania Fibonacciego, ten wskaźnik:

  • Eliminuje subiektywność
  • Aktualizuje się dynamicznie wraz ze strukturą rynku
  • Pomaga traderom zidentyfikować strefy wysokiego prawdopodobieństwa wejścia, wyjścia i odwrócenia

Działa na dowolnym rynku (Forex, Złoto, Kryptowaluty, Indeksy) i na wszystkich interwałach czasowych.


⚙️ Jak to działa

  • Skanuje ostatnie X liczby świec (Lookback Bars)
  • Wykrywa:
    • Najwyższe maksimum
    • Najniższe minimum
  • Określa kierunek trendu:
    • 📈 Trend wzrostowy → Fib rysowany od Min → Max
    • 📉 Trend spadkowy → Fib rysowany od Max → Min
  • Automatycznie rysuje te poziomy:
    • 0.0
    • 23.6%
    • 38.2%
    • 50.0%
    • 61.8%
    • 78.6%
    • 100%


🎯 Jak skutecznie go używać w handlu

1. 🔥 Wejścia oparte na trendzie (NAJLEPSZA STRATEGIA)

📈 W trendzie wzrostowym:

  • Czekaj, aż cena cofa się
  • Skup się na tych strefach:
  • Wejdź w KUPNO, gdy:
    • Pojawi się świeca wzrostowa
    • Silny sygnał kupna (z innego wskaźnika)

📉 W trendzie spadkowym:

  • Czekaj, aż cena cofnie się w górę
  • Skup się na:
  • Wejdź w SPRZEDAŻ, gdy:
    • Pojawi się świeca spadkowa
    • Silny sygnał sprzedaży


2. 🎯 Wejście snajperskie (zaawansowana konfiguracja 🔥)

Połącz swoje poziomy Fib z istniejącym systemem:

Przykład KUPNA:

  • Trend = wzrostowy
  • Cena cofa się do 0.5 lub 0.618
  • Twój wskaźnik pokazuje:
    • ✅ Silny sygnał kupna
    • ✅ Świeca z dużym korpusem
    • ✅ Niska górna knota

👉 WEJDŹ W KUPNO (Wejście snajperskie)

Przykład SPRZEDAŻY:

  • Trend = spadkowy
  • Cena cofa się do 0.5 lub 0.618
  • Sygnał potwierdza:
    • ❌ Silny sygnał sprzedaży

👉 WEJDŹ W SPRZEDAŻ


3. 💰 Cele Take Profit

Używaj poziomów Fib jako stref TP:

  • TP1 → 0.236
  • TP2 → Poprzednie maksimum/minimum (0.0 lub 1.0)
  • TP3 → Wybicie poza 1.0 (kontynuacja trendu)


4. 🛑 Ustawienie Stop Loss

Inteligentne ustawienie SL:

  • Poniżej 0.786 (dla KUPNA)
  • Powyżej 0.786 (dla SPRZEDAŻY)

To zapobiega wybijaniu stopów przez normalny szum rynkowy.


5. ⚠️ Unikaj tych błędów

❌ Handel na rynku bocznym
❌ Wejścia bez potwierdzenia
❌ Używanie Fib samodzielnie (zawsze łącz z sygnałami)
❌ Ignorowanie trendu na wyższych interwałach


🧠 Profesjonalne wskazówki (styl BOSS FX)

  • Łącz z:
    • Filtr trendu EMA / HMA
    • Silne sygnały kupna / sprzedaży (Twój system 🔥)
  • Najlepsze interwały:
    • M5 (skalpowanie)
    • M15 (wejścia snajperskie)
    • H1 (potwierdzenie)
  • Najlepsze aktywa:
    • XAUUSD (Złoto)
    • EURUSD
    • GBPJPY


🚀 Najlepsza kombinacja strategii (ZALecana)

Użyj tego ustawienia:

  • Automatyczne Poziomy Fibonacciego ✅
  • Twój wskaźnik silnego kupna/sprzedaży ✅
  • Potwierdzenie trendu na wielu interwałach ✅

👉 To tworzy wysokoprecyzyjny system handlu snajperskiego


📌 Podsumowanie

Ten wskaźnik pomaga Ci:

  • Automatycznie zidentyfikować strukturę rynku
  • Handlować cofnięcia jak profesjonalista
  • Wchodzić w strefy wysokiego prawdopodobieństwa
  • Usunąć zgadywanie z użycia Fibonacciego


Skup się na wygrywaniu!

Podsumowanie

Podsumowanie AI
The Fibonacci Automated Levels Indicator is a trading tool that automatically identifies the most recent market swing high and low within a specified lookback period and plots key Fibonacci retracement levels on the chart. It dynamically updates with market structure, removing subjectivity from manual Fibonacci drawing. The indicator detects trend direction—drawing Fibonacci levels from low to high in uptrends and high to low in downtrends—and plots standard retracement levels: 0.0, 23.6%, 38.2%, 50.0%, 61.8%, 78.6%, and 100%.

It supports all markets including Forex, Gold, Cryptocurrencies, and Indices, and works across all timeframes. Traders can use it to identify high-probability entry, exit, and reversal zones by focusing on pullbacks to key Fibonacci levels (notably 0.382 to 0.618). The indicator is designed to be combined with other signals and trend filters for confirmation, enhancing trade accuracy. It also provides guidance on take profit targets and stop loss placement to manage risk effectively.

Recommended usage includes trend-based entries, sniper entries combining Fibonacci levels with other indicators, and multi-timeframe trend confirmation. The indicator is suitable for scalping and various trading styles, helping traders automate market structure analysis and improve pullback trading decisions.
Profil wskaźnika

Opinie klientów

4.0
Opinie: 3
5
0 %
4
100 %
3
0 %
2
0 %
1
0 %
Opinie klientów
April 13, 2026
A decent setup here should survive 0.5 Fib without looking messy. Risk and average R matter more than one clean screenshot.
April 11, 2026
I liked it more as a review layer for Fib based analysis than as something to follow blindly. Pullbacks feel easier to plan, and the final decision still feels like it belongs to the trader.
April 11, 2026
For Fib based analysis, the practical question is whether it reduces bad decisions. A 90 setup journal on New York open makes that clearer.

Dyskusja

Częste pytania

Signal
Indices
Commodities
GBPUSD
RSI
Bollinger
Fibonacci
Scalping
AI
XAUUSD
NAS100
MACD
BTCUSD
Forex
Breakout
EURUSD
NZDUSD
Martingale
Prop
ZigZag
Supertrend
Fair Value Gap
SMC
Crypto
Grid
Stocks
ATR
USDJPY
VWAP
Produkty dostępne za pośrednictwem cTrader Store, w tym boty handlowe, wskaźniki i wtyczki, dostarczane są przez deweloperów zewnętrznych i udostępniane wyłącznie w celach informacyjnych oraz w celu zapewnienia dostępu technicznego. cTrader Store nie jest brokerem i nie zapewnia doradztwa inwestycyjnego, nie udziela spersonalizowanych rekomendacji ani nie gwarantuje przyszłych wyników.

Więcej od tego autora

Wskaźnik
Market Sessions is very important for traders.
Wskaźnik
Signal
Fractal Arrow Buy and Sell Indicator
Wskaźnik
The Break of Structure (BoSCHoCh) Indicator is a smart market structure tool designed to help traders easily spot trend.
Wskaźnik
MultiTF Pivot and SR Indicator
Logo „Zigzag Trend”
Najwyżej oceniane
4.5
(4)
$25
/
$45
Wskaźnik
AI
ATR
+23
The ZigZag Trend is a market structure tool that filters out small price fluctuations and highlights major swing.
cBot
AI
SMC
+18
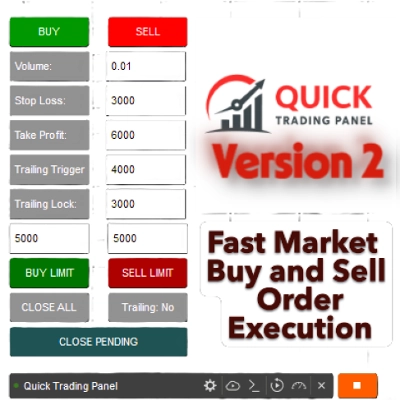
Quick Trading Panel Cbot allows you to trade faster using a panel in a chart. This includes Trailing Trigger and Locked.
3
Współczynnik zysku
Wskaźnik
Area of Interest with the power of AI to detect the market interest.
Wskaźnik
Prop
Forex
+13
Volume Meter
Wskaźnik
AI
ATR
+23
Candle Timer best used for Scalper
Wskaźnik
AI
ATR
+27
Intraday MultiTimeframe Candle Status Indicator
Wskaźnik
The Market BIAS Detector is a smart trading assistant designed to identify the market.
Wskaźnik
Forex
Spread Calculator to calculate the difference between two prices or values.

Możesz także polubić

Wskaźnik
ATR
Signal
One of the best indicators we have ever developed, with a very high profit ratio.
Wskaźnik
RSI
Breakout
+1
📊 Liquidation Map: Potential areas where highly leveraged investors might face liquidations.
Wskaźnik
BOS
CHOCH
+4
Dual-track market structure detection with BVC order flow confirmation and two-stage liquidity sweep validation.
Logo „ZigXRay”
Najwyżej oceniane
4.6
(5)
$29
/
$49
Wskaźnik
CHOCH
Key Levels
+5
ZigZag Market Structure Identifier - Multi-Layer Scanner: Convergent Pivot Detection, 4-TF Overlay & Naked Chart Mode.
Wskaźnik
AI
ATR
+5
🦅 AI Institutional System: Order Blocks, Volume Delta Profile, OrderFlow Limit Buy/Sell, MTF, psychology & reversal.
Wskaźnik
XAUUSD
Professional Volume Profile Indicator - Shows volume distribution, POC, Value Areas & Buy/Sell pressure.
Wskaźnik
Track VWAP for Asia, London, NY, Sydney, Daily, Weekly, Monthly & Custom Sessions. Perfect for FX & intraday trading!
Wskaźnik
Forex
BTCUSD
+5
Buy-Side & Sell-Side Liquidity (BSL/SSL) Indicator
Wskaźnik
Imbalance
Risk Dashboard
+2
FX‑DESK RISK MANAGEMENT — Cross‑Asset Correlation Heatmap, Info Panel & Trade Signals
Wskaźnik
CHOCH
Fair Value Gap
+2
Advanced FVG & IFVG indicator with multi-timeframe confluence, CHoCH filtering, and smart mitigation.
Wskaźnik
BOS
Key Levels
+2
Maps bullish and bearish order block zones, CE levels and structure-based price action context.
Wskaźnik
Prop
Forex
+13
🐠 Coral Filter X Pro turns trend detection into a simple, repeatable workflow 🐠
Wskaźnik
ATR
Channel
+3
Catch trend with precision. BUY/SELL arrows, real-time dashboard, sound alerts and ATRchannel. Works on all markets.
Wskaźnik
VWAP
Volume
+4
Advanced Order Flow & Volume Profiling for cTrader. Unveil institutional footprints, Delta, and Anchored VWAPs.
Wskaźnik
Key Levels
Support & Resistance
Professional Opening Range Breakout indicator with live ORB levels and breakout detection.
Wskaźnik
EURUSD
GBPUSD
+3
All-in-one suite for ICT concepts: NY Midnight Open, Killzones, automatic Liquidity levels (PDH/L, PWH/L).
Wskaźnik
SMC
Prop
+15
Auto-detects Swing Highs/Lows to draw dynamic Support & Resistance levels with break tracking.
Wskaźnik
Prop
Forex
+5
Visualize trading volume by price within any range, highlight POC and key value areas.

Cena

Od 29/05/2025
3.04M
Wolumen transakcji
45.22K
Zysk w pipsach
29
Sprzedaż
810
Bezpłatne instalacje