
Описание
Camarilla от Bullitt Traders — Визуализируйте структуру. Торгуйте точно.
Профессиональный индикатор пивотов Camarilla для cTrader, созданный для отображения реакции цены вокруг институциональных уровней.
Он автоматически строит все ключевые уровни Camarilla (R1–R5 / S1–S5) и пивот-точки на нескольких таймфреймах — предоставляя трейдерам чёткую структурную карту для разворотов и пробоев.
Основные функции
- ✅ Истинная формула Camarilla — рассчитывает уровни по максимуму, минимуму и закрытию предыдущего периода.
- 📊 Логика Multi-TF — выбирайте между дневным, недельным или месячным периодом пивотов.
- 🕒 Историческое отображение — автоматически рисует прошлые периоды для визуального контекста и анализа структуры.
- 🎨 Настраиваемый стиль — регулируйте ширину, стиль и цвет линий для каждого режима (бычий, медвежий, нейтральный).
- 💬 Метки и цены — включайте или отключайте отображение текста и значений для чистого или детального вида.
- ⚡ Лёгкий и не перерисовывающийся — оптимизирован для скорости и точности на любом инструменте.
- 🧩 Работает со всеми типами графиков — совместим с таймфреймами, диапазонными, тиковыми и Renko.
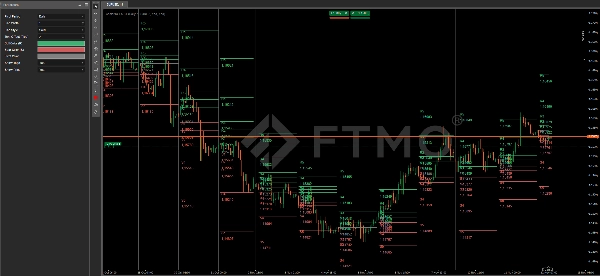
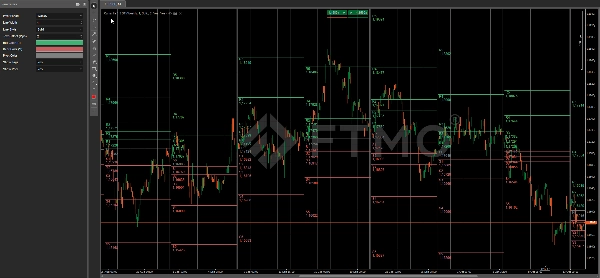
Уровни Camarilla
R5 – зона экстремальной цели пробоя
R4 – основное сопротивление, потенциальный триггер пробоя
R3 – верхняя зона разворота, часто используется для коротких позиций
R2 – сопротивление среднего уровня
R1 – начальное сопротивление, уровень ранней реакции
PP – центральная пивот-точка (зона среднеобратного движения)
S1 – начальная поддержка, уровень ранней реакции
S2 – поддержка среднего уровня
S3 – нижняя зона разворота, часто используется для длинных позиций
S4 – основная поддержка, потенциальный триггер пробоя
S5 – зона экстремальной цели пробоя
Параметры
Период пивота – выберите дневной, недельный или месячный для расчёта уровней
Ширина линии – настройте общую толщину линии
Стиль линии – установите сплошной, точечный или штриховой
Смещение текста (пипсы) – расстояние между линией и меткой
Цвет быков (R) – цвет для уровней сопротивления (R1–R5)
Цвет медведей (S) – цвет для уровней поддержки (S1–S5)
Цвет пивота – цвет центральной линии пивота (PP)
Показывать метки – показывать или скрывать имена уровней R/S
Показывать цену – показывать или скрывать числовые ценовые метки
Как использовать
Зоны R3–S3 → типичные внутридневные зоны разворота
Уровни R4–S4 → подтверждения пробоя или продолжения
R5–S5 → цели высокой волатильности и зоны истощения
Сводка
Key features include automatic plotting of historical pivot levels for context, customizable line width, style, and colors for bullish, bearish, and neutral regimes, and options to show or hide level labels and price values. The indicator is lightweight, non-repainting, and compatible with various chart types such as time, range, tick, and Renko charts.
Camarilla levels serve specific roles: R3–S3 zones indicate typical intraday reversal areas; R4–S4 levels suggest breakout or continuation confirmations; and R5–S5 mark extreme breakout targets and high-volatility exhaustion zones. This tool provides a clear structural map to assist traders in identifying potential reversals, breakouts, and target zones across multiple markets including Forex, indices, commodities, cryptocurrencies, and stocks.
Отзывы покупателей
5 | 100 % | |
4 | 0 % | |
3 | 0 % | |
2 | 0 % | |
1 | 0 % |


