
CursorByte.SupportResistance v3
指标
292 下载
版本 1.0, Mar 2025
Windows 版、Mac 版
5.0
评价:1
说明
***改进版***
https://ctrader.com/products/2113
***********************
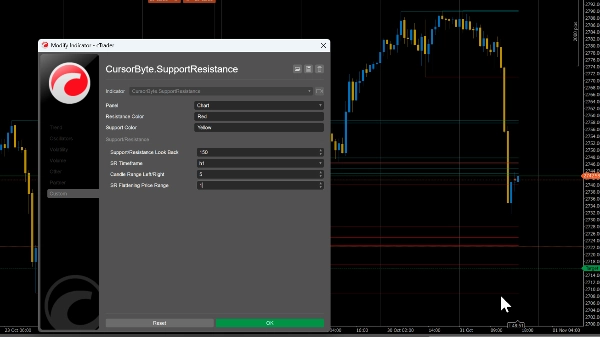
您可以根据货币对设置平滑价格范围。对于像GU这样的货币对使用 0.0001,黄金则使用1.5。
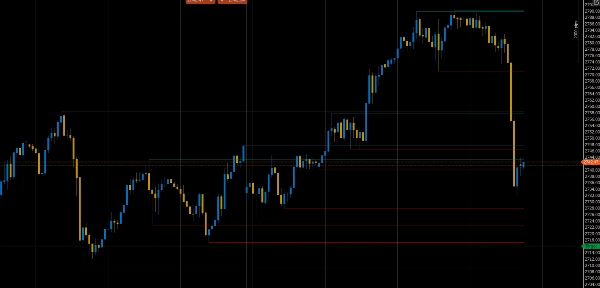
该指标自动识别图表上的关键支撑和阻力位,帮助交易者发现潜在的反转区域、突破点和价格盘整区域,从而做出更好的进出场决策。
注意:使用平滑价格范围可以减少图表上的杂乱(将特定价格范围内的支撑阻力线合并为一条)。
摘要
指标配置
客户评价
5.0
评价:1
5 | 100 % | |
4 | 0 % | |
3 | 0 % | |
2 | 0 % | |
1 | 0 % |
客户评价
August 12, 2025
Pros: Accurate auto SR levels, customizable design, stable performance. Cons: No significance filter, no auto-clear, possible chart clutter.
讨论
常见问答
Breakout
Commodities
XAUUSD
cTrader Store 提供的所有产品,包括交易机器人、指标和插件,均由第三方开发者提供,仅供信息参考和技术访问之用。cTrader Store 并非经纪商,不提供投资建议、个人推荐或任何未来业绩保证。


价格
注册日期 31/10/2024
56
销售
1.75K
免费安装