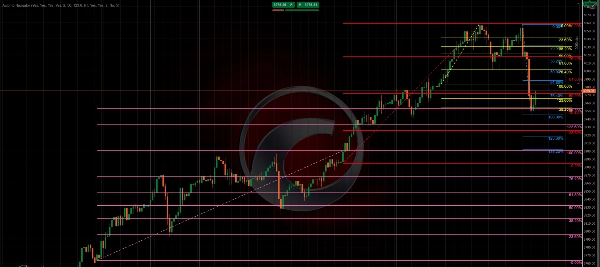
指标
NAS100
NZDUSD
XAUUSD
Commodities
Forex
EURUSD
GBPUSD
BTCUSD
Indices
Prop
Stocks
Crypto
USDJPY
AutoFib Navigator
"AutoFib Navigator" 标识
09/10/2025
Desktop
Since 31/10/2024
销售
4
Free installs
1366
"AutoFib Navigator" 已上传图片

AutoFib Navigator automatically draws Fibonacci retracements for the Daily, Yesterday, Current Week, and Previous Week sessions.
It provides a clear and consistent view of market retracements, extensions, and session-based swing behavior without manual plotting.

The tool intelligently adapts to price action — updating only when price moves beyond a configurable Target Trigger (e.g., 123.6%) — ensuring your chart remains accurate and uncluttered throughout the trading day or week.


Key Features

  • Automatic Fibonacci Zones: Draws Daily, Yesterday, Weekly, and Previous Week retracements in real time.
  • Smart Redraw Logic: Recalculates only after price breaks the defined target extension, avoiding unnecessary re-anchoring.
  • Directional Awareness: Automatically flips Fibonacci orientation based on price relative to the 50% retracement level.
  • Customizable Parameters: Colors, visibility, timeframe, line thickness, and redraw behavior can all be adjusted.
  • Optimized Performance: Lightweight background process using a timed update system for efficiency.
  • Professional Presentation: Clean and consistent chart visuals suitable for all trading styles.


Recommended Use

Use AutoFib Navigator to identify dynamic retracement and expansion levels across daily and weekly sessions.
It is ideal for traders who rely on Fibonacci confluence, structure analysis, or multi-session setups.

该作者的其他作品
指标
XAUUSD
Breakout
Commodities
CursorByte.SupportResistance v3
Draws support and resistance on all pairs. Multi-timeframe support.
cBot
Prop
Commodities
Forex
+1
Risk Manager v1_1
Daily profit/loss risk manager with lock feature—auto-stops trading once limits are hit.
指标
NAS100
NZDUSD
XAUUSD
+16
Market Structure Pro
Auto-detect support and resistance & structure, highlight pullbacks/BOS retests, and filter with candle confirmation.
猜您喜欢
指标
Indices
Prop
Stocks
+5
New Way Sar - Free
The Parabolic SAR, or "Stop and Reverse," is a dynamic technical analysis tool
指标
Grid
Indices
Breakout
+8
TSPivotSMC
Pivot Point MultiTimeFrame with Order Block
指标
Grid
XAUUSD
Forex
+3
Daily Open Color Zones
indicator showing the Daily Open Line and instantly shading bullish and bearish zones.
Stochastic RSI Indicator
Market Polarity Zones
implifies market analysis by automatically identifying bullish 🚀 or bearish 🐻 phases and marking key levels where ....
OHLC PRO by LudwigICT
OHLC PRO – Advanced Session & Market Structure Tool
指标
RSI
Breakout
Supertrend
Swing Levels
🔍 Automatically detect support and resistance levels based on "swings" or pivots
Microchannels
Microchannels
指标
RSI
Commodities
Signal
+1
Dot Momentum %BB Indicator
Dynamic circles visualize price's volatility position. Like RSI for market overextension & stretch. Quantify context.
指标
NAS100
NZDUSD
XAUUSD
+14
Elliott Wave Fib Auto
🚀 Automated Elliott Wave & Fibonacci tool for cTrader. Spot trends, corrections & retracements fast.
指标
Indices
Breakout
Prop
+4
Higher TimeFrame Candle Tracker
Higher TimeFrame Candle Tracker: Current Timeframe (Any TimeFrame) Show High TimeFrame Candle Bar
ICT Killzones & Macros
KILLZONES AND MACRO SESSIONS
VWAP Tank Btn
Custom Vwap Indicator
指标
MACD
IR Macd on Chart
this indicator show macd on chart.
Market Sessions Advanced
Advanced Market Sessions with ICT killzones
MTF Candle Window - On Chart
The Multi-Timeframe Candle Indicator displays candles from multiple timeframes in one window, enhancing market analysis!
Retro_Shooting_Game
trading stress-relief “mini-game”
Laguerre RSI
Laguerre RSI is based on John EHLERS' Laguerre Filter to avoid the noise of RSI.