
说明
📊 每日点差范围仪表板(会话对齐的ADR工具)
该 每日点差范围仪表板 是一款专业的交易工具,直接在您的图表上显示实时的每日范围统计数据——完全与您的经纪商的UTC会话对齐。
专为精准交易者设计,该工具使用基于真实会话的每日边界计算高低点差范围,并提供强大的滚动统计数据,用于市场背景和波动性分析。
🔥 主要功能
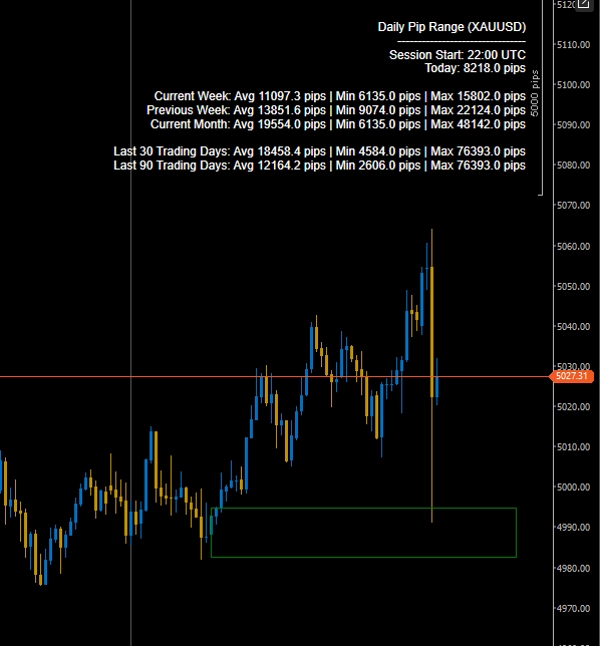
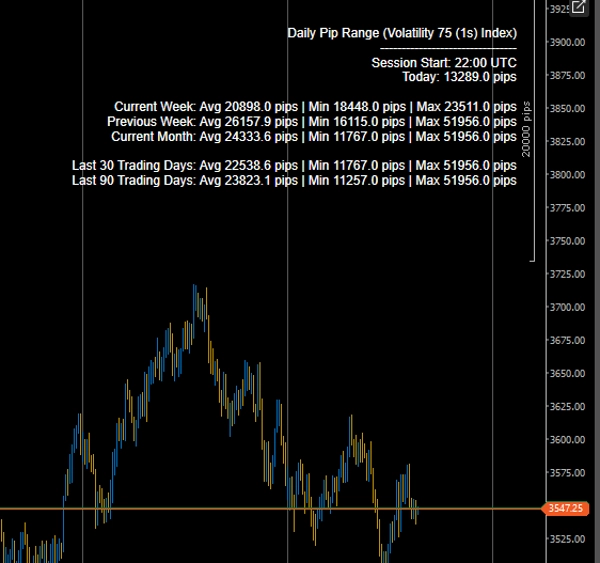
✅ 今日实时每日范围(点差中的高低)
查看当前会话的点差范围实时更新。
✅ 会话对齐计算(UTC控制)
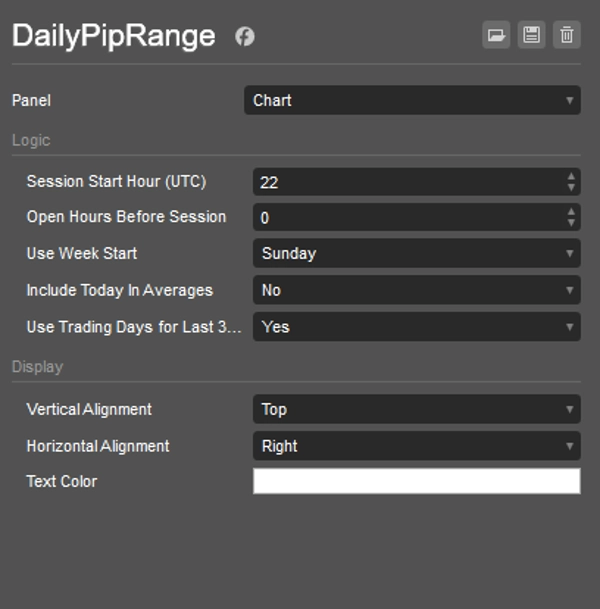
定义:
- 会话开始小时(UTC)
- 会话前的开放小时数
这确保您的每日统计数据与您的经纪商的交易日匹配——非常适合纽约收盘对齐和机构风格分析。
✅ 高级统计细分
对于每个周期,指标显示:
- 平均每日范围
- 最小每日范围
- 最大每日范围
包含的周期:
- 当前周
- 上一周
- 当前月
- 过去30天
- 过去90天
✅ 交易日或日历日切换
选择:
- 过去30/90个日历日
- 过去30/90个交易日(仅限日线)
非常适合过滤周末和非交易间隙。
✅ 可定制显示
- 可调节屏幕位置(右上角等)
- 文本颜色自定义
- 轻量且不干扰的覆盖层
🎯 为什么使用此工具?
- 识别波动性扩张和收缩
- 将今日范围与历史平均值比较
- 发现突破前的压缩
- 基于ADR背景筛选交易
- 根据波动性状况改进风险规模
无论您是进行日内交易、波段交易还是黄金交易,该工具都能为您提供即时的波动性情报且不杂乱。
⚙️ 适用对象
- 外汇交易者
- 黄金(XAUUSD)交易者
- 指数交易者
- 基于波动性的系统
- 突破交易者
- 机构风格的范围分析
🚀 专业波动性意识——直接显示在您的图表上
为性能、准确性和会话精度而打造。
摘要
指标配置
客户评价
4.5
评价:2
5 | 50 % | |
4 | 50 % | |
3 | 0 % | |
2 | 0 % | |
1 | 0 % |
讨论
常见问答
Signal
Indices
Commodities
GBPUSD
RSI
Bollinger
Fibonacci
Scalping
AI
XAUUSD
NAS100
MACD
BTCUSD
Forex
Breakout
EURUSD
NZDUSD
Martingale
Prop
ZigZag
Supertrend
Fair Value Gap
SMC
Crypto
Grid
Stocks
ATR
USDJPY
VWAP
cTrader Store 提供的所有产品,包括交易机器人、指标和插件,均由第三方开发者提供,仅供信息参考和技术访问之用。cTrader Store 并非经纪商,不提供投资建议、个人推荐或任何未来业绩保证。


价格
注册日期 31/10/2024
56
销售
1.73K
免费安装