
BreakOut_Probability_Expo
指标
486 下载
版本 1.0, Apr 2025
Windows 版、Mac 版
5.0
评价:1
说明
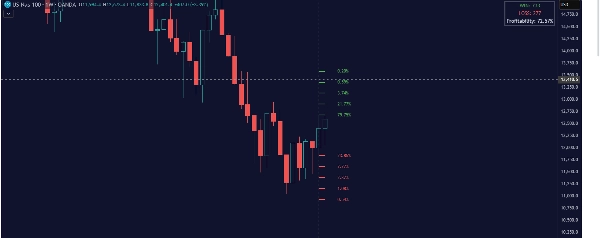
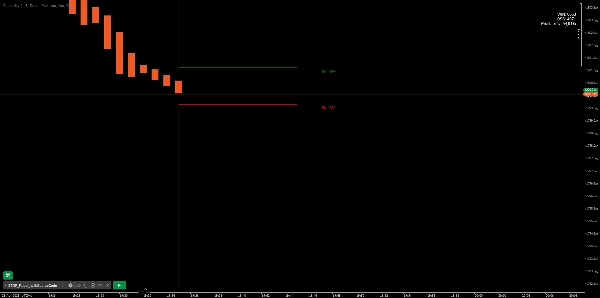
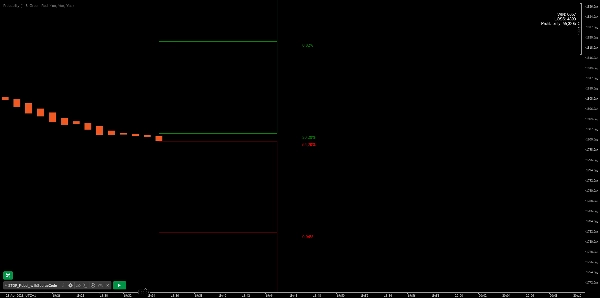
突破概率 是一个有价值的指标,用于计算新高或新低的概率,并以百分比形式显示为一个水平。新高和新低的概率经过回测,结果显示在表格中——这是一种简单的方式来理解下一根蜡烛形成新高或新低的可能性。此外,该指标还显示了蜡烛上方和下方的另外四个水平及达到这些水平的概率。
该指标帮助交易者理解下一根蜡烛方向的可能性,从而可以用来设定您的交易偏好。
█ 计算方法
该算法根据前一根蜡烛是红色还是绿色,分别计算所有绿色和红色蜡烛,并在达到一条或多条线时赋予分数。然后算法计算历史上有多少蜡烛达到了这些水平,并以百分比值显示在每条线上。
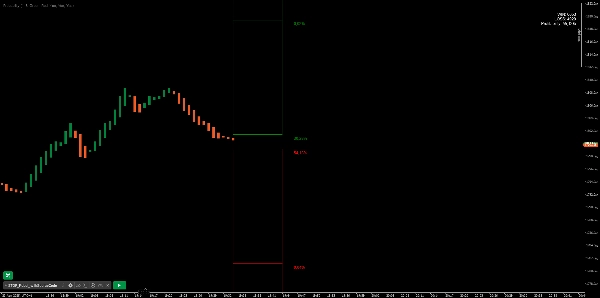
█ 示例
在此示例中,前一根蜡烛是绿色;我们可以看到新高的命中率为72.82%,而新低仅为28.29%。在这种情况下,形成了一个新高。
摘要
AI 摘要
BreakOut_Probability_Expo is an indicator designed to calculate and display the probability of a new high or low occurring in the next candlestick. It provides these probabilities as percentage levels, supported by backtested historical data shown in a table format. The indicator separately analyzes green and red candles based on the color of the previous candle, assigning scores when price levels are reached. It then calculates the frequency of these occurrences in history to estimate the likelihood of hitting these levels again. Additionally, it displays four extra probability levels above and below the current candle to indicate potential price targets. This tool helps traders assess the probable direction of the next candle, aiding in setting trading bias. The indicator’s calculations are based on historical candle behavior, offering a statistical perspective on breakout probabilities.
指标配置
客户评价
5.0
评价:1
5 | 100 % | |
4 | 0 % | |
3 | 0 % | |
2 | 0 % | |
1 | 0 % |
客户评价
August 18, 2025
Clear probability display, effective for breakout strategies, customizable. Cons: No alerts, no MTF mode, possible delays on big history.
讨论
常见问答
Breakout
cTrader Store 提供的所有产品,包括交易机器人、指标和插件,均由第三方开发者提供,仅供信息参考和技术访问之用。cTrader Store 并非经纪商,不提供投资建议、个人推荐或任何未来业绩保证。


价格
注册日期 09/01/2025
11.78K
免费安装