
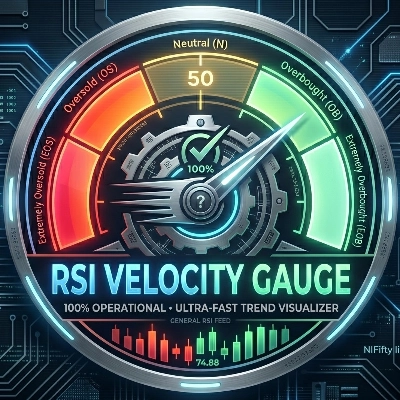
RSI Velocity Gauge
지표
108 다운로드
버전 1.0, May 2026
Windows, Mac
4.5
리뷰: 2

가입일 27/02/2026
33.16K
거래량
25.96K
핍 수익
10
판매
536
무료 설치
설명
모두에게 무료
🏎️ RSI Velocity Gauge Pro 📊
cTrader를 위한 궁극의 실시간 모멘텀 HUD 및 트렌드 시각화 도구
시장 모멘텀을 보는 방식을 RSI Velocity Gauge Pro로 혁신하세요. 복잡하고 분리된 오실레이터 서브 윈도우는 이제 그만. 이 프리미엄 지표는 세련된 기계식 대시보드를 차트 위에 직접 오버레이하여 시장 속도, 강도 및 소진 지점을 즉각적이고 고해상도로 제공합니다.
고급 삼각함수 UI 스케일링과 실시간 차트 페인팅 로직으로 설계된 이 지표는 단순한 지표 그 이상이며, 거래 레이아웃을 위한 완벽한 실행 제어 센터입니다.
⚡ 주요 기능
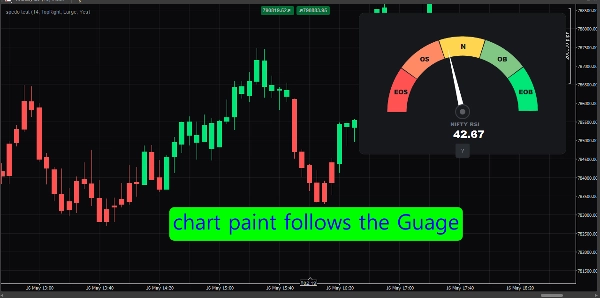
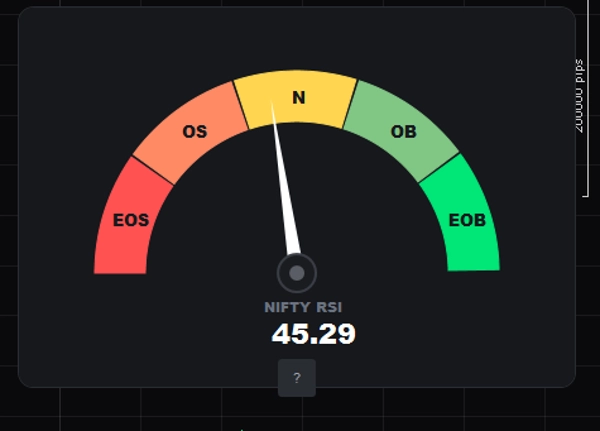
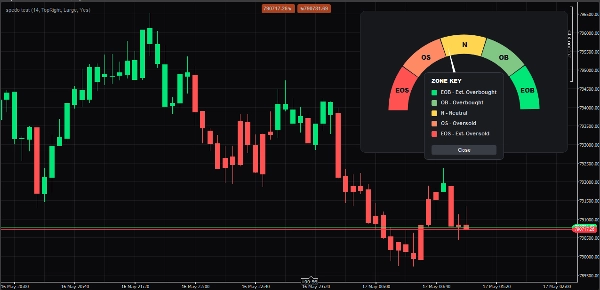
- 🧭 동적 기계식 대시보드: 모든 틱에서 실시간으로 상대강도지수(RSI)를 추적하는 멋진 다크 모드 방사형 속도계.
- 🎨 심리적으로 올바른 색상 코딩: 실시간 시장 압력에 완벽하게 반전된 색상. 왼쪽은 압도적인 매도자 통제(빨강/주황)를 나타내고, 오른쪽은 공격적인 매수자 속도(초록/민트)를 표시합니다.
- 🕯️ 스마트 캔들 페인팅: 가격 움직임에 집중하세요. 지표는 강세 모멘텀(RSI > 50) 동안 차트 캔들을 자동으로 녹색으로, 약세 환경(RSI < 50)에서는 빨간색으로 칠합니다.
- 🧠 인터랙티브 팝업 범례 (
?버튼): 차트를 깔끔하고 미니멀하게 유지하세요. 인터랙티브한 원형?버튼을 클릭하면 정확한 약어와 해당 색상을 상세히 보여주는 우아하고 고급스러운 존 키를 즉시 토글할 수 있습니다. - 📐 완전 반응형 UI 스케일링: 소형, 중형 또는 대형 보기 중 선택하세요. 이 지표는 모든 모니터 해상도(4K 포함)에 완벽하게 맞도록 모든 기하학적 요소, 글꼴 크기, 여백 및 테두리 반경을 동적으로 계산합니다.
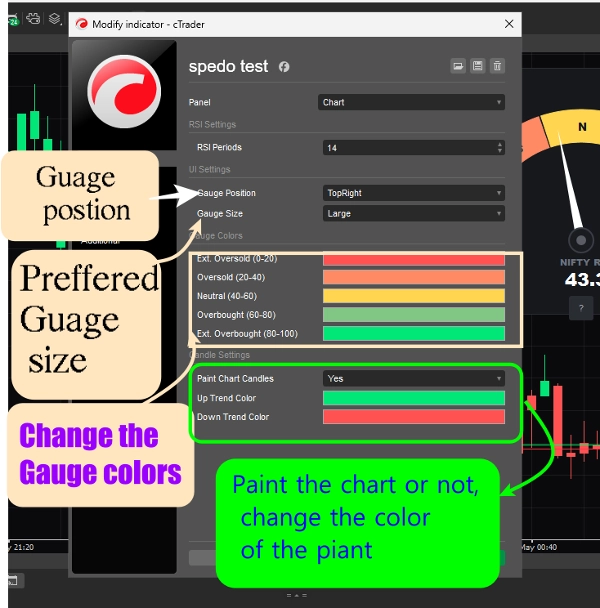
- 📍 유동적 코너 위치 지정: 중요한 가격 움직임을 방해하지 않도록 게이지 위치를 쉽게 이동할 수 있습니다. 상단 왼쪽, 상단 오른쪽, 하단 왼쪽 또는 하단 오른쪽 중 선택 가능하며 자동 패딩 조정이 적용됩니다.
- 🎛️ 네이티브 색상 선택기: 번거로운 16진수 코드는 필요 없습니다! cTrader의 원활한 드롭다운 색상 그리드를 사용해 5개 모멘텀 밴드와 트렌드 캔들의 색상을 자유롭게 맞춤 설정하세요.
🔍 존 범례 키
대시보드의 인라인 ? 버튼을 클릭하여 사용자 정의 존 규칙을 확인하세요:
- 🟥 EOS (극단적 과매도 | 0–20): 최대 매도 소진. 잠재적 반전 구간.
- 🟧 OS (과매도 | 20–40): 강한 약세 속도. 매도세가 확고히 지배.
- 🟨 N (중립 | 40–60): 시장 균형 구간. 횡보 또는 통합 움직임.
- 🟩 OB (과매수 | 60–80): 강한 강세 속도. 매수세가 확고히 지배.
- 🟩 EOB (극단적 과매수 | 80–100): 최대 매수 소진. 잠재적 되돌림 구간.
⚙️ 사용자 정의 가능한 매개변수
- RSI 설정: 계산 기간을 손쉽게 조정하세요 (기본값: 14).
- UI 위치 지정: 드롭다운 레이아웃 선택기 (상단 왼쪽, 상단 오른쪽, 하단 왼쪽, 하단 오른쪽).
- UI 크기 조절: 원활한 반응형 스케일러 (소형, 중형, 대형).
- 게이지 색상: 5개 모멘텀 밴드 각각에 대한 독립적인 팔레트 선택기.
- 캔들 설정: 배경 캔들 페인팅을 활성화/비활성화하는 전역 토글, 사용자 정의 상승 및 하락 트렌드 브러시 선택기 포함.
요약
AI 요약
The RSI Velocity Gauge is a momentum indicator designed for cTrader that overlays a dynamic, mechanical-style dashboard directly on trading charts. It provides real-time tracking of the Relative Strength Index (RSI) on every tick, visualized as a radial speedometer with color-coded zones indicating market momentum and pressure. The gauge uses a dark-mode interface with colors representing seller dominance (red/orange) and buyer dominance (green/mint).
Key features include automatic candle coloring to reflect bullish (green) or bearish (red) momentum based on RSI values, an interactive pop-up legend explaining zone meanings, and fully responsive UI scaling with adjustable sizes (small, medium, large) and corner positioning options. Users can customize RSI calculation periods, gauge colors for five momentum bands, and toggle candle painting on or off.
The indicator divides RSI values into five zones: Extreme Oversold (0–20), Oversold (20–40), Neutral (40–60), Overbought (60–80), and Extreme Overbought (80–100), helping identify potential reversal or exhaustion points. The RSI Velocity Gauge serves as a comprehensive momentum visualization tool, integrating smoothly into trading layouts for enhanced market speed, strength, and trend analysis.
지표 프로필
지표 카테고리
모멘텀
출력 유형
시각화
필터
신호
데이터 요구 사항
막대만
틱 데이터
거래량
DoM
외부 데이터
지원되는 신호
변동성
추세 강도
레벨 돌파
레벨 터치
반전
크로스
다이버전스
돌파
상담
고객 리뷰
4.5
리뷰: 2
5 | 50 % | |
4 | 50 % | |
3 | 0 % | |
2 | 0 % | |
1 | 0 % |
고객 리뷰
September 10, 2026
RSI Velocity Gauge provides a clear radial RSI HUD, accurate zone mapping, candle coloring and a useful interactive legend. Testing on EURUSD and XAUUSD worked well across M1–D1. The main issue is the incorrect hard-coded “NIFTY RSI” label shown on other symbols; live per-tick updating was not independently verified.
자주 묻는 질문(FAQ)
RSI
AI-assisted
Moving Average
트레이딩 봇, 지표, 플러그인 등 cTrader Store에서 제공되는 상품은 제3자 개발자에 의해 제공되며, 이는 단순히 정보 및 기술적 접근을 목적으로 제공된 것입니다. cTrader Store는 중개인이 아니며, 투자 조언, 개인별 추천 또는 향후 성과에 대한 어떠한 보장도 제공하지 않습니다.
이 작성자의 상품 더 보기

















가격
가입일 27/02/2026
33.16K
거래량
25.96K
핍 수익
10
판매
536
무료 설치