
FVG_Bruno
Wskaźnik
Wersja 1.0, Oct 2025
Windows, Mac
4.0
Opinie: 2
Opis
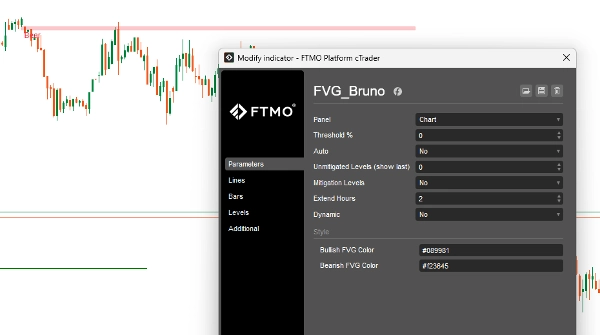
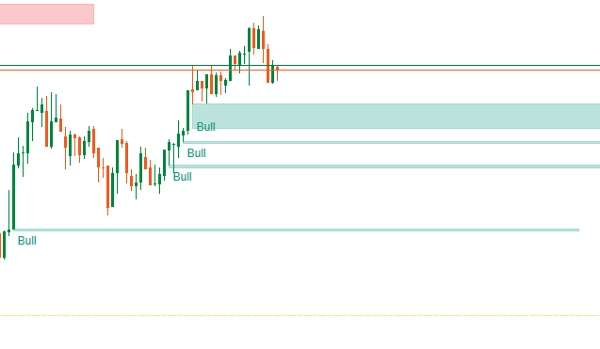
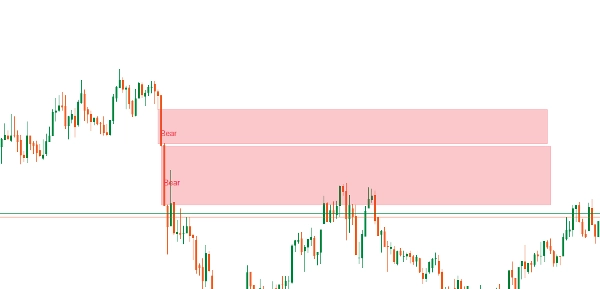
FVG to luka cenowa, która powstaje, gdy rynek porusza się gwałtownie w jednym kierunku, pozostawiając lukę między kolejnymi świecami. Ta luka reprezentuje obszar, gdzie płynność nie została w pełni wymieniona, a cena często wraca do niej później, aby „wypełnić” tę nierównowagę.
Na przykład:
- W ruchu wzrostowym, jeśli Świeca 1 zamyka się, a Świeca 3 otwiera się znacznie powyżej maksimum Świecy 1, pozostawiając minimum Świecy 2 nietknięte, ta luka to FVG.
- Traderzy oczekują, że cena cofnie się do tej luki, zanim kontynuuje trend.
Podsumowanie
Profil wskaźnika
Opinie klientów
4.0
Opinie: 2
5 | 0 % | |
4 | 100 % | |
3 | 0 % | |
2 | 0 % | |
1 | 0 % |
Dyskusja
Częste pytania
BTCUSD
Forex
Signal
Indices
EURUSD
Commodities
GBPUSD
NZDUSD
Prop
Fair Value Gap
Crypto
Stocks
XAUUSD
NAS100
USDJPY
Produkty dostępne za pośrednictwem cTrader Store, w tym boty handlowe, wskaźniki i wtyczki, dostarczane są przez deweloperów zewnętrznych i udostępniane wyłącznie w celach informacyjnych oraz w celu zapewnienia dostępu technicznego. cTrader Store nie jest brokerem i nie zapewnia doradztwa inwestycyjnego, nie udziela spersonalizowanych rekomendacji ani nie gwarantuje przyszłych wyników.
Więcej od tego autora


![Logo „[Stellar Strategies] MARSI Signal Plotter”](https://cdn.ctrader.com/image/webp/7b2b8da6-8f8e-4646-8d4a-4710c516c01e_25567)


Cena
Od 22/10/2025
303.42M
Wolumen transakcji
49
Zysk w pipsach
1
Sprzedaż