Açıklama
📈 Stokastik RSI
Stokastik RSI göstergesi, fiyat yerine RSI değerlerine Stokastik formülünü uygulayan bir momentum osilatörüdür ve bu nedenle ikinci türev göstergesidir. Standart RSI'den daha yüksek hassasiyetle aşırı alım ve aşırı satım koşullarını belirlemede özellikle faydalıdır.
🛠️ Parametreler
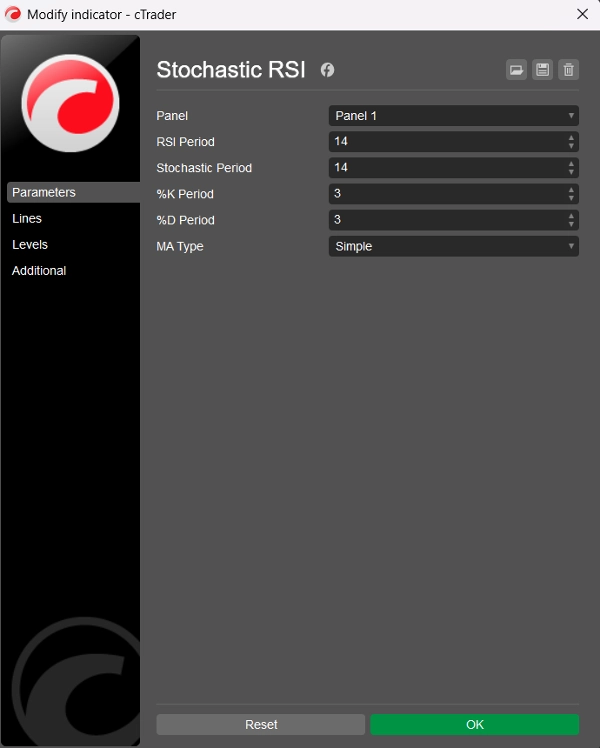
RSI Periyodu: Temel RSI'yı hesaplamak için kullanılan geriye dönük dönem (varsayılan = 14)
Stokastik Periyodu: Stokastik RSI'yı hesaplamak için RSI değerlerine uygulanan geriye dönük dönem (varsayılan = 14)
%K Periyodu: %K çizgisi için yumuşatma dönemi (varsayılan = 3)
%D Periyodu: %D çizgisi için yumuşatma dönemi (varsayılan = 3)
MA Türü: Yumuşatma için hareketli ortalama türü: 11 tür seçeneği (varsayılan = Basit)
📊 Çıktı Çizgileri
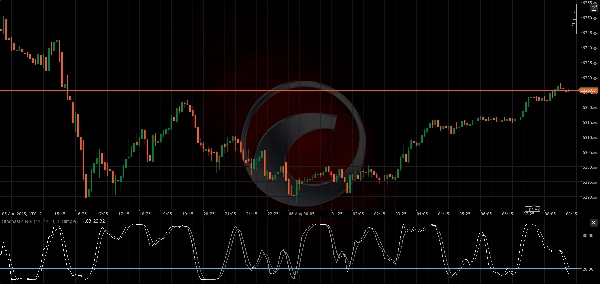
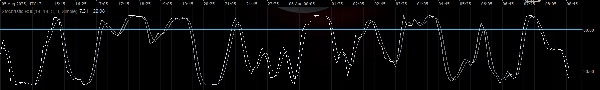
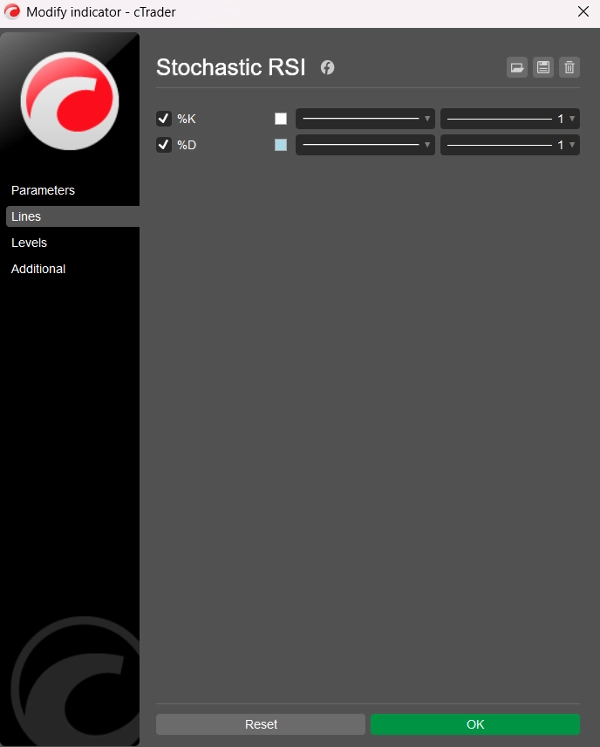
- %K Çizgisi: Yumuşatılmış Stokastik RSI (beyaz)
- %D Çizgisi: %K'nın yumuşatılmış hareketli ortalaması (açık mavi)
Her iki çizgi de 0 ile 100 arasında salınım yapar ve aşırı alım ve aşırı satım okumalarını net şekilde sağlar.
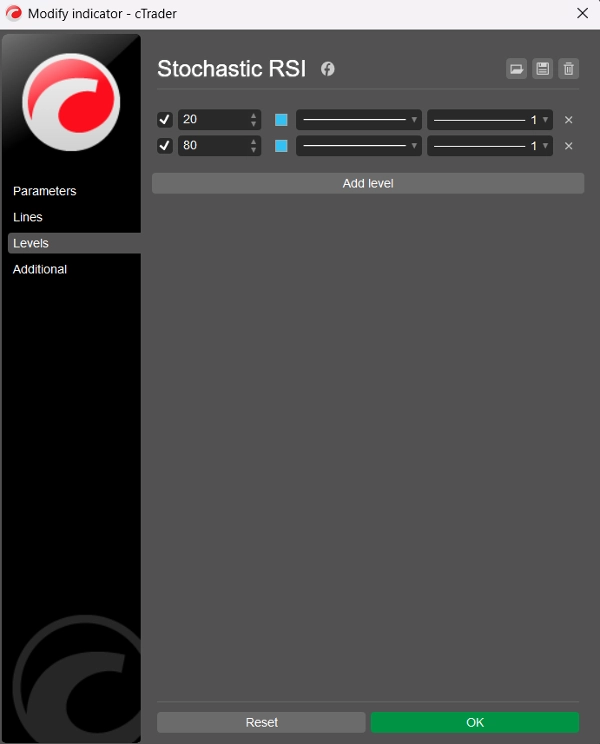
⚠️ Önerilen Seviyeler
Gösterge varsayılan olarak statik seviyeler göstermese de, kullanıcıların bunları cTrader'da “Seviyeler” sekmesinden manuel olarak eklemeleri önerilir:
- Seviye 80 → Aşırı Alım
- Seviye 20 → Aşırı Satım
Bu seviyeler, geleneksel Stokastik Osilatör ile benzer şekilde çalışır ancak RSI davranışına uygulanır; bu da sinyalleri daha keskin ve genellikle daha hızlı yapar.
🧠 Nasıl Kullanılır
- Aşırı Alım (>80): Fiyatın yukarı yönde aşırı genişlemiş olabileceğini gösterir — dönüş veya konsolidasyon potansiyeli.
- Aşırı Satım (<20): Fiyatın aşırı satılmış olabileceğini işaret eder — olası sıçrama veya trend dönüşü.
- %K ve %D Kesişimleri: Stokastik veya MACD gibi kullanılabilir — 20'nin altında yükseliş kesişimi veya 80'in üzerinde düşüş kesişimi işlem için uygun olabilir.
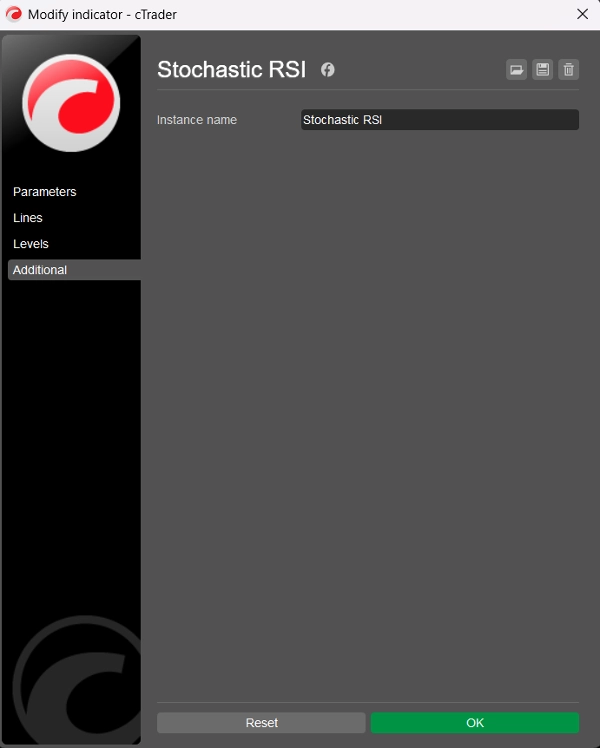
🏷️ Notlar
- C# ve Automate API kullanılarak cTrader için geliştirilmiştir
- Temiz, verimli ve 11 MA türü ile özelleştirilebilir
- Kod ve mantık BlueRocketBots & ChatGPT (OpenAI) tarafından
- Temiz kod (toplam 99 satır; 54 satır kod, 27 satır metin, 18 satır boş)
- Geliştirilmiş V2 versiyonu
- Ücretsiz!
Özet
Key parameters include the RSI Period (default 14), Stochastic Period (default 14), %K and %D smoothing periods (default 3 each), and a choice among 11 moving average types for smoothing (default is Simple). The indicator outputs two lines: the %K line (smoothed Stochastic RSI) and the %D line (smoothed moving average of %K), both oscillating between 0 and 100.
Suggested manual levels for interpretation are 80 (overbought) and 20 (oversold). Traders may use these levels along with %K and %D crossovers to identify potential price reversals or consolidations. For example, a bullish crossover below 20 or a bearish crossover above 80 can signal actionable market moves.
The indicator is implemented in clean, efficient C# code using the Automate API, allowing customization and integration within cTrader.