
Descrizione
VmmSignalAverage PRO trial è un indicatore di trading completo che combina più sistemi di analisi tecnica in un unico strumento potente. Rileva i principali pattern grafici e fornisce segnali visivi chiari per decisioni di trading migliori.
CARATTERISTICHE PRINCIPALI:
12 Tipi di Medie Mobili: inclusi (Mediana), SMA, EMA, Doppia EMA, Tripla EMA, Hull, Serie Temporali, Triangolare, VIDYA, Ponderata, Wilder Smoothing, Kaufman Adaptive
Sistema di Segnali Basato su ATR: utilizza l'Average True Range per calcoli dinamici delle distanze
6 Sistemi di Rilevamento Pattern:
Fair Value Gaps (FVG) con colori personalizzabili
Identificazione dei Gap di Prezzo
Pattern Inside Bar
Segnali di inversione Reverse123
Pattern Wick con rapporti configurabili
Frecce di direzione del trend
Filtro Trend Intelligente: mostra segnali solo nella direzione del trend
Ottimizzato per le Prestazioni: sistema di cache integrato per un funzionamento fluido
Pulizia Automatica: mantiene il grafico pulito e organizzato
COME USARE:
Configurazione Base:
Aggiungi l'indicatore al tuo grafico
Configura il tipo e il periodo della media mobile
Abilita/disabilita il rilevamento dei pattern secondo necessità
Segnali di Trading:
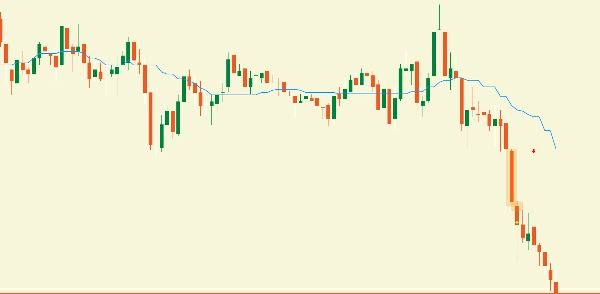
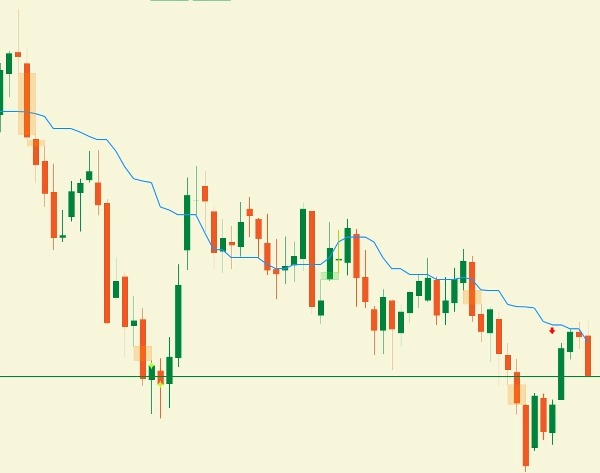
Segnali Rialzisti: appaiono durante trend rialzisti (cerchi/stelle verdi)
Segnali Ribassisti: appaiono durante trend ribassisti (cerchi/stelle rosse)
Aree FVG: rettangoli evidenziati che mostrano zone di squilibrio
Gap: contrassegnati con rettangoli colorati
Inside Bars: visualizzati con colori personalizzabili
Configurazione Parametri:
Gruppo Medie Mobili:
Tipo di Calcolo: scegli tra 12 tipi di MA
Periodo: periodo MA (3-100)
Tipo di Prezzo: fonte del prezzo per i calcoli
Prezzo Intelligente per Mediana: selezione intelligente del prezzo per il calcolo della mediana
Impostazioni Trend:
Mostra Frecce Trend: visualizza frecce di direzione del trend
Controllo Barre Precedenti: quante barre analizzare per il trend
Rilevamento Trend Rigoroso: usa regole di trend rigorose o rilassate
Filtro Trend: 0=mostra tutti i segnali, 1=mostra solo segnali in linea con il trend
Gruppi di Pattern (FVG, GAP, INSIDEBAR, Reverse123, Wick):
Abilita/Disabilita: attiva o disattiva ogni tipo di pattern
Colori: personalizza i colori rialzisti/ribassisti
Opacità: controlla la trasparenza delle evidenziazioni dei pattern
Soglie di Dimensione: dimensioni minime dei pattern in pips
Moltiplicatori ATR: distanza dinamica basata sulla volatilità di mercato
Impostazioni ATR:
Periodo ATR: usa lo stesso periodo per il calcolo dell'Average True Range
Usa ATR: abilita distanza dinamica basata sulla volatilità
Moltiplicatori ATR: regola la sensibilità per diversi pattern
Pulizia del Grafico:
Mantieni Ultime Barre: quante barre storiche visualizzare
Pulizia Automatica del Grafico: pulizia automatica degli oggetti vecchi
VANTAGGI DI PRESTAZIONE:
Sistema di calcolo ottimizzato riduce l'uso della CPU
Caching intelligente previene calcoli ridondanti
Pulizia automatica mantiene le prestazioni del grafico
Registrazione delle prestazioni configurabile per il monitoraggio
IMPOSTAZIONI CONSIGLIATE:
Day Trading: Periodo 20, Trend Rigoroso = false
Swing Trading: Periodo 50, Trend Rigoroso = true
Scalping: Periodo 10, Trend Rigoroso = false
SUPPORTO:
Per domande o supporto, fare riferimento alle impostazioni dell'indicatore o contattare tramite cTrader Store.
NOTA: Questo è uno strumento di analisi tecnica. Usa sempre una corretta gestione del rischio e combina con altri metodi di analisi per le decisioni di trading.
TAG: riconoscimento pattern, analisi tecnica, segnali di trading, medie mobili, ATR, FVG, price action, pattern grafici, indicatore di trading, strumenti professionali
***** CARATTERISTICHE DISABILITATE NELLA VERSIONE DI PROVA *****
FVG (Fair Value Gaps): disabilitato (TRIAL_SHOW_FVG = false)
Pattern Reverse 123: disabilitato (TRIAL_SHOW_REVERSE123 = false)
ATR per Pattern Wick: disabilitato (TRIAL_USE_ATRWick = false)
Tipi di Medie Mobili: disponibile solo SMA
Flessibilità del Periodo: fissata a 21
Analisi Storica: fissata a 3 barre
Riepilogo
Users can customize moving average types, periods, price sources, and pattern detection settings including colors, opacity, and size thresholds. The ATR settings enable dynamic distance calculations based on volatility, enhancing signal accuracy. The tool features automatic chart cleanup to maintain clarity and optimized performance through caching and reduced CPU usage.
Trading signals are visually represented with bullish (green) and bearish (red) markers, along with highlighted pattern zones. Recommended configurations are provided for day trading, swing trading, and scalping. This indicator serves as a comprehensive pattern recognition and signal tool to assist in informed trading decisions when combined with proper risk management.
Recensioni dei clienti
5 | 100 % | |
4 | 0 % | |
3 | 0 % | |
2 | 0 % | |
1 | 0 % |


![Logo di "[Hamster-Coder] Moving Average MTF"](https://cdn.ctrader.com/image/webp/b11b98b1-194d-4b8e-b00e-d611826ad159_31226)


