
الوصف
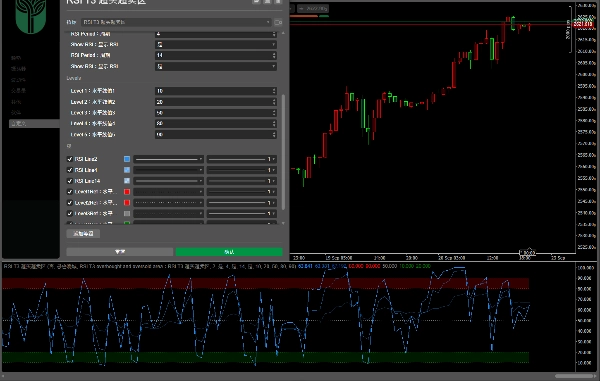
مؤشر القوة النسبية بثلاثة معلمات مع مناطق التشبع الشرائي/التشبع البيعي
(يمكن تعديل المعلمات ومناطق التشبع الشرائي/التشبع البيعي بشكل مستقل؛ يمكن تشغيل أو إيقاف كل خط دورة على حدة)، مما يسهل مراقبة الرنين متعدد الدورات:
• اتساق الاتجاه:
يتحرك مؤشر القوة النسبية للدورات القصيرة والمتوسطة والطويلة في نفس الاتجاه. إذا ظل مؤشر القوة النسبية للدورة القصيرة فوق مؤشر القوة النسبية للدورات المتوسطة والطويلة، فهذا يشير إلى اتجاه صعودي؛ وإلا، فإنه يشير إلى اتجاه هبوطي.
• التباعد والانعكاس:
عندما يصل السعر إلى قمة/قاع جديد لكن مؤشر القوة النسبية للدورة القصيرة لا يتبع ذلك، ويضعف/يتعافى مؤشر القوة النسبية للدورات المتوسطة والطويلة، فهذا يشير إلى احتمال حدوث تراجع/ارتداد.
• تأكيد التشبع الشرائي/التشبع البيعي:
عندما يدخل مؤشر القوة النسبية لدورة واحدة منطقة التشبع الشرائي أو التشبع البيعي، يجب الجمع بين الحكم مع الدورات الأخرى؛ إذا دخلت عدة دورات منطقة التشبع الشرائي أو التشبع البيعي في نفس الوقت، فإن الإشارة تكون أكثر موثوقية.
• رنين الدورات:
عندما ترسل مؤشرات القوة النسبية لعدة دورات نفس الإشارة (على سبيل المثال، جميعها تخترق خط الوسط 50)، تكون احتمالية استمرار الاتجاه أو انعكاسه أعلى، مما يمكن أن يساعد في اتخاذ القرار.
带超买超卖区域的三参数 RSI
(可自主调整参数与超买超卖区域,支持单独开关各周期线),便于观察多周期共振:
•趋势一致性:
短、中、长周期 RSI 同向运行,短周期在中长周期上方为多头趋势;反之则为空头趋势。
•背离与反转:
价格创新高 / 低但短周期 RSI 未同步,且中长周期 RSI 走弱 / 回升,提示可能回调 / 反弹。
•超买超卖确认:
单周期超买超卖时,需结合其他周期判断;多周期同时超买超卖,信号更可靠。
•周期共振:
多周期 RSI 同发信号(如均突破 50 中轴线),趋势延续或反转的概率更高,可辅助决策。
الملخص
- Trend Consistency: Identifies bullish or bearish trends based on the relative positions of short-, medium-, and long-cycle RSIs.
- Divergence and Reversal Signals: Detects potential pullbacks or rallies when price movements diverge from short-cycle RSI behavior while medium- and long-cycle RSIs weaken or recover.
- Overbought/Oversold Confirmation: Enhances signal reliability by combining overbought or oversold conditions across multiple RSI cycles.
- Cycle Resonance: Highlights stronger trend continuation or reversal probabilities when multiple RSI cycles simultaneously signal, such as crossing the 50 midline.
This indicator supports detailed momentum analysis by integrating multi-timeframe RSI data, aiding traders in decision-making through comprehensive trend and reversal insights.
تقييمات العملاء
5 | 0 % | |
4 | 100 % | |
3 | 0 % | |
2 | 0 % | |
1 | 0 % |


