
Description
Profil de liquidité et d'absorption des baleines
Suivez l'argent institutionnel, analysez le flux des ordres et repérez les zones de retournement avec une précision volumétrique
Le Profil de liquidité et d'absorption des baleines n'est pas votre profil de volume traditionnel. C'est une suite d'analyse de la microstructure du marché qui décompose chaque transaction pour vous montrer non seulement où le volume a été échangé, mais qui l'a échangé (institutionnel vs. détail) et comment le prix a interagi à ces niveaux (agression vs. absorption).
Il dispose d'un moteur de rendu optimisé qui projette toutes les données à droite du prix actuel, gardant votre graphique complètement propre et sans latence.
Caractéristiques principales
- Filtre de force (Baleines uniquement) : Utilise un algorithme de percentile (par exemple, top 97 %) pour séparer le volume institutionnel (« Fort ») du volume de détail (« Faible »). Vous pouvez activer le mode « Fort uniquement » pour suivre exclusivement l'empreinte de l'argent intelligent.
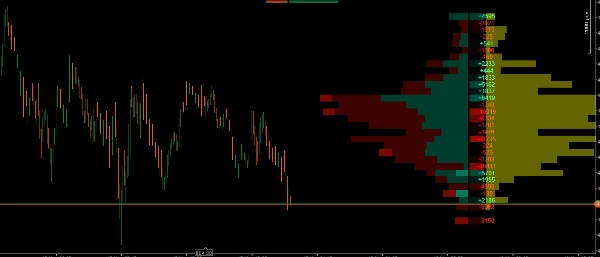
- Profil de volume empilé : Affiche visuellement la répartition du volume haussier et baissier par niveau de prix, facilitant l'identification du Point de Contrôle (POC) et des Nœuds de Volume Haut/Bas (HVN/LVN).
- Détection automatique de la zone de valeur : Met en évidence les niveaux de prix où le pourcentage le plus élevé de volume a été échangé (par défaut 70 %), en atténuant les zones extérieures pour lire facilement le contexte du marché d'un coup d'œil.
- Profil Delta (Carte thermique) : Calcule la différence exacte entre les achats et les ventes sur le marché à chaque niveau de prix. Il inclut des valeurs numériques et une carte thermique visuelle pour repérer rapidement qui contrôle agressivement.
- Profil d'absorption (zones jaunes) : Mesure le volume piégé spécifiquement dans les mèches des chandeliers. Cela vous permet de voir graphiquement exactement où l'argent intelligent absorbe passivement la liquidité des traders de détail piégés.
- Performance optimisée : Les calculs volumétriques lourds ne sont traités que sur la dernière bougie, garantissant que votre plateforme cTrader fonctionne de manière fluide et efficace, même sur des unités de temps inférieures.
Comment utiliser cet indicateur dans votre trading ?
Cet indicateur fournit 3 couches de confirmation pour vos trades. Voici comment les combiner efficacement :
1. Définissez le contexte avec le profil de volume et la zone de valeur
- Utilisez le profil de volume pour identifier où l'acceptation du prix est la plus élevée (zone de valeur et POC).
- Stratégie : Cherchez des opportunités d'achat en bas de la zone de valeur (support) et des opportunités de vente en haut de la zone de valeur (résistance).
2. Évaluez l'agression avec le profil Delta
- Lorsque le prix atteint votre niveau clé (par exemple, une zone de support), regardez la colonne Delta.
- Stratégie : Si vous cherchez à acheter au support, vous voulez voir un Delta fortement positif (vert) à ce niveau, indiquant que les acheteurs interviennent agressivement. Si le Delta reste fortement négatif, les vendeurs dominent toujours.
3. Trouvez le déclencheur parfait avec le profil d'absorption (le cœur de l'indicateur)
- C'est là que l'outil brille vraiment. Souvent, le marché semble chuter fortement (Delta négatif fort), pourtant le prix cesse de baisser. Pourquoi ? Parce que les « baleines » utilisent des ordres limites pour absorber toute cette pression de vente.
- Stratégie (trade de retournement) : Si vous voyez le prix descendre vers un niveau critique et que le Delta est négatif (vendeurs de détail piégés), mais qu'une grande barre jaune apparaît soudainement dans le Profil d'absorption, cela signifie que les institutions viennent d'absorber toute la liquidité dans cette mèche. C'est votre déclencheur optimal pour entrer dans la direction opposée !
4. Utilisez le « Filtre de force » pour couper à travers le bruit
- Si le marché est en consolidation et que la direction est incertaine, activez l'option « Fort uniquement ». Cela masquera tout le bruit de détail non pertinent et vous montrera exactement où les gros fonds accumulent ou distribuent leurs positions.
Résumé
A Delta Profile heatmap calculates the net difference between market buys and sells at each price level, showing buyer or seller aggression. The Absorption Profile identifies volume trapped in candlestick wicks, revealing where institutional traders absorb liquidity from retail participants. The indicator’s optimized engine processes heavy volumetric calculations only on the latest candle, ensuring smooth performance on the cTrader platform.
Traders can use this tool to define market context, evaluate buying or selling aggression, and pinpoint reversal triggers based on absorption patterns. The "Strong Only" mode filters out retail noise during consolidation phases, focusing on institutional accumulation or distribution zones. This indicator supports volume and DOM data visualization to enhance decision-making around key support and resistance levels.
Avis clients
5 | 100 % | |
4 | 0 % | |
3 | 0 % | |
2 | 0 % | |
1 | 0 % |


