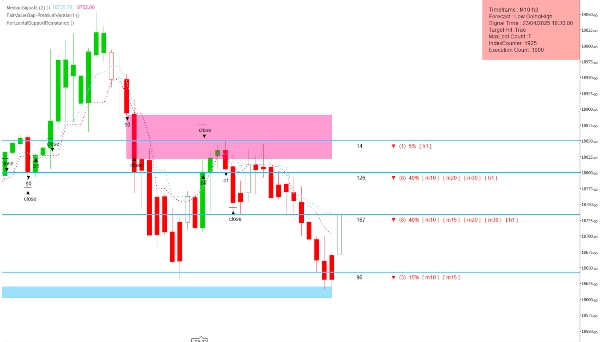
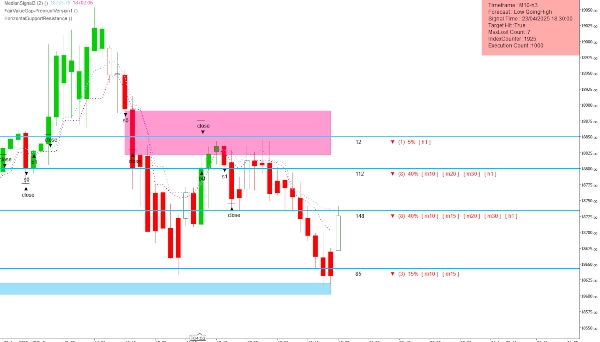
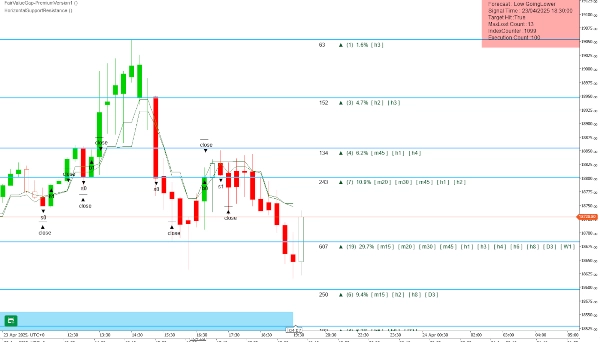
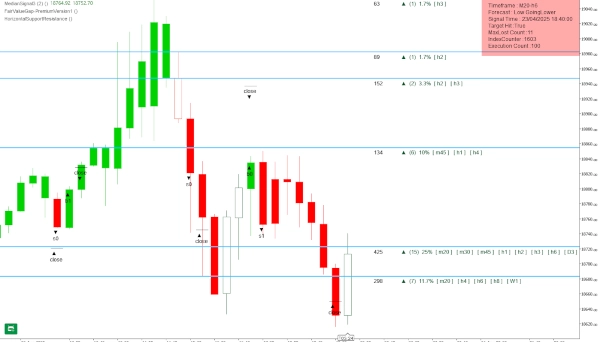
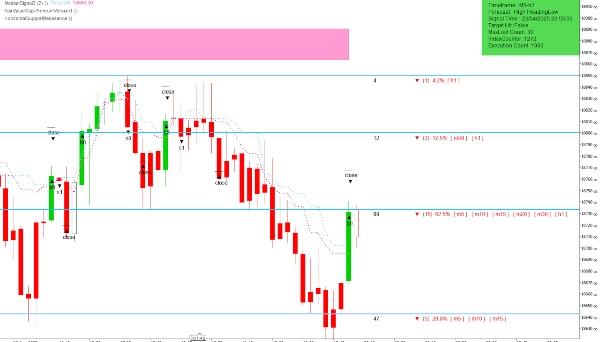
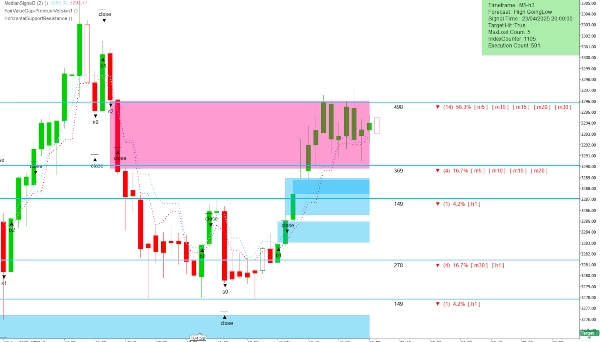
Broker und Props
Für Unternehmen
00
Days
:
00
Hours
:
00
Minutes
:
00
Seconds
Indikator
Indices
Stocks
Forex
GBPUSD
Scalping
HorizontalSupportResistance
4.5
03/09/2025
488
Desktop
Seit 19/04/2025
Gehandeltes Volumen
284.2M
Pip-Gewinn
1.07M
Verkäufe
7
Kostenlose Installationen
2050
In „HorizontalSupportResistance“ hochgeladenes BildIn „HorizontalSupportResistance“ hochgeladenes BildIn „HorizontalSupportResistance“ hochgeladenes BildIn „HorizontalSupportResistance“ hochgeladenes BildIn „HorizontalSupportResistance“ hochgeladenes BildIn „HorizontalSupportResistance“ hochgeladenes Bild

This extraordinary multi timeframe support and resistance indicator is nothing short of market wizardry. Designed with precision and backed by smart logic, it identifies critical price levels on all forex, indices, or stocks but especially on the NASDAQ100 with uncanny accuracy. Like a seasoned trader’s intuition encoded into a visual tool, it highlights key zones where price reacts, reverses, or accelerates—giving you an edge that feels almost supernatural. With clean candlestick representation and vibrant, clearly marked levels, this indicator doesn’t just follow the market—it anticipates it. Whether you're scalping short-term moves or holding longer-term positions, this tool acts like your personal trading oracle, quietly guiding you to smarter, more confident decisions.

4.5
Bewertungen: 2
5
50 %
4
50 %
3
0 %
2
0 %
1
0 %
Kundenbewertungen
August 12, 2025
Pros: Accurate auto SR levels, customizable appearance, lightweight. Cons: No level strength filter, no alerts, possible chart clutter.
June 20, 2025
The Indicator is excellent, What's the core logic of this Indicator, Kindly share if you don't mind.
Mehr von diesem Autor
Beste Ratings
Kostenlos
FairValueGap
This Fair Value Gap (FVG) indicator is a technical analysis tool used to identify potential price imbalances.
Indikator
Signal
FairValueGap-PremiumVersion1
This Fair Value Gap (FVG) indicator is a technical analysis on multi-timeframe.
Beste Ratings
Kostenlos
BarSentiments
This Indicator is a technical analysis tool that measures the strength and direction of market sentiment
Das könnte Sie auch noch interessieren
Indikator
Breakout
Higher Timeframe Candlestick
Overlay a real-time higher-timeframe candle on your chart — color-coded bias without switching TFs.
Indikator
Breakout
Signal
AI
Verve Ai Range Scalper
ICT Channel – Precision buy/sell signals , customizable settings , User-Friendly Interface
Advanced Market Structure Bos,Choch,SwinLevels, Order Blog
Advanced price action tool that combines multiple technical analysis concepts
Indikator
Breakout
XAUUSD
Forex
+2
McDonalds Pattern-Bzier Curve
Designed to identify and visualize price reversal patterns using Bézier curves.
Indikator
RSI
Breakout
XAUUSD
+6
ZigZag
ZigZag filters noise, spots trends, patterns, pivots, aiding analysis, trade management, and confirmations. 📉📈
Indikator
NAS100
NZDUSD
Breakout
+14
ZIG ZAG Free
ZigZag Free is a clean swing-detection tool that marks significant pivot highs/lows
Indikator
NAS100
NZDUSD
Martingale
+26
Square Matrix Trading System
Square Matrix Trading System by LudwigICT – Institutional-Grade Trading Clarity in cTrader
Indikator
Indices
XAUUSD
Forex
+3
Trend Following Trial2
TREND FALLOWING: Advanced technical indicator signal.
Indikator
Grid
NAS100
RSI
+21
Market Cipher B
Market Cipher B
Indikator
Indices
Breakout
XAUUSD
+9
Market Bias Gauge
Measure Market Strength at a Glance – Instantly
Indikator
Grid
Breakout
Martingale
+4
Coloring Trendline with arrows
Coloring trendline/ Colored Trendline / Color Trendline
Indikator
NAS100
NZDUSD
XAUUSD
+10
ALMA-Gaussian Trend Filter
📈 Adaptive ALMA-Gaussian hybrid trend filter with precision smoothing and clear buy/sell signals.
Indikator
NAS100
NZDUSD
XAUUSD
+13
Chandelier Exit
Optimize exits with Chandelier Exit! Visualize stop-loss points dynamically for improved trading precision and safety.
Indikator
NAS100
XAUUSD
Commodities
+11
SCOB
SCOB - Single Candle Order Block Indicator
Momentum Trend Analyzer
Provides comprehensive trend and momentum analysis by combining EMAs, RoC, normalized ATR, RSI, and volume..
DMI CUSTOM SESSIONS
This will allow you to have SESSIONS on the chart. London, New York, Asian session and you can customize the times.
Indikator
Indices
RSI
XAUUSD
+9
RsiMultiFrameOBOS
Multi-Timeframe Trend Dots RSI
Beste Ratings
Kostenlos
Indikator
ATR
Supertrend
PMAX
It's a combination of two trailing stop loss and the other one is well-known ATR-based SuperTrend.