Beschreibung
AKTUALISIERTE VERSION VERFÜGBAR — HIER
Eine aktualisierte Version dieses Indikators wurde mit wichtigen Fehlerbehebungen und Verbesserungen veröffentlicht:
- Behobene Volumenverteilung: Proportionale Zuweisung basierend auf Kerzenüberlappung (statt 100 % an alle berührten Levels)
- Behobene VAH/VAL-Erkennung: Toleranz skaliert jetzt mit der Höhe des Levels statt eines fest codierten Werts
- Behobene Textpositionierung: Dynamische, zeitrahmenbasierte Versätze statt fest codierter Tage
- Zeitzonen-Versatz-Parameter: Für DateTime-Profile
- Textpositions-Parameter: Links-/Rechts-Option für Lookback-Modus
- Leistungsverbesserungen: Binäre Suche für DateTime-Lookup, zwischengespeicherte Volumenberechnungen, optimierte Wörterbuchoperationen
__________________________________________________________________________________________
WICHTIGE HINWEISE - ZUERST LESEN
Forex-Volumen ist kein echtes Volumen
Volumen im Forex ist Tick-Volumen — es zählt, wie oft sich der Preis ändert. Es zählt NICHT, wie viel Geld gehandelt wurde.
Was Tick-Volumen nicht zeigen kann
- Handelsgröße. Ein $100-Trade und ein $10.000.000-Trade zählen beide als 1 Tick.
- Echten Geldfluss. Sie können nicht sehen, ob großes oder kleines Geld den Preis bewegt hat.
- Wahre Liquidität. Sie können nicht sehen, wie viele Aufträge im Markt warten.
- Bankaktivität. Banken sehen echte Volumendaten. Sie nicht.
Was das bedeutet
Tick-Volumen zeigt nur, wie oft sich der Preis geändert hat — nicht das dahinterstehende Geld. Das führt zu Problemen:
- Sie können Banken oder Institutionen nicht verfolgen. Sie verwenden echte Volumendaten, auf die Sie keinen Zugriff haben.
- Sie können "Smart Money"-Theorien nicht beweisen. Diese Ideen benötigen echtes Volumen, nicht Tick-Zählungen.
- Sie können wahre Liquidität nicht beurteilen. Tick-Aktivität zeigt keine Auftrags-Tiefe oder echte Marktstärke.
- Sie können echte Kauf- oder Verkaufskraft nicht messen. Viele kleine Trades sehen genauso aus wie ein großer institutioneller Trade.
- Volumenspitzen können täuschen. Eine Spitze könnte nur algorithmisches Rauschen sein, kein echtes Handelsinteresse.
Wie man diesen Indikator richtig verwendet
- Betrachten Sie ihn als Aktivitätsmesser, nicht als Geldmesser. Hohes Tick-Volumen = Markt ist beschäftigt. Niedriges Tick-Volumen = Markt ist ruhig. Nicht mehr.
- Vergleichen Sie die Aktivität zu verschiedenen Zeiten. Verwenden Sie ihn, um zu sehen: Ist die London-Session geschäftiger als New York? Ist heute aktiver als gestern? Ist die Trendperiode geschäftiger als die Konsolidierung?
- Kombinieren Sie ihn mit der Preisstruktur. Verwenden Sie Unterstützung/Widerstand, Swing-Punkte oder BOS/ChoCH zusammen mit Volumen. Der Preiskontext verhindert falsche Signale durch laute Volumenspitzen.
- Beobachten Sie die Aktivität an wichtigen Preisniveaus. Wenn der Preis ein Schlüssel-Level testet und das Tick-Volumen steigt, bedeutet das, dass mehr Trader aktiv sind. Es bedeutet NICHT, dass große Akteure beteiligt sind.
- Gehen Sie nicht davon aus, dass es institutionelle Aktivität zeigt. Tick-Volumen kann keine Akkumulation, große Aufträge oder "Smart Money" zeigen. Verwenden Sie es nur, um Rhythmus und Tempo zu messen.
__________________________________________________________________________________________
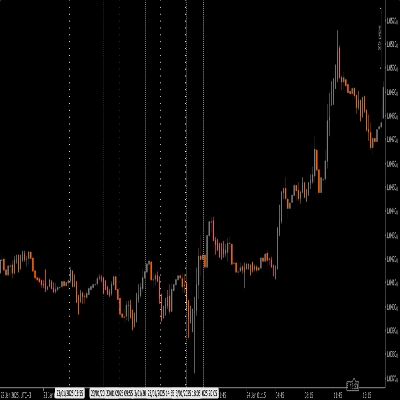
Visualisieren Sie Volumenverteilung und Zeit-am-Preis mit POC, Value Area und Market Profile TPO Tracking.
Dieser Indikator zeigt die Volumenverteilung mit Market Profile Konzepten. Er zeigt den Point of Control (Level mit der höchsten Tick-Aktivität), Value Area Grenzen (wo der meiste Handel stattfand), TPO-Buchstabenfolgen (verbrachte Zeit auf jedem Preis) und Delta-Visualisierung, die die Tick-Aktivität nach Kerzenrichtung aufteilt.
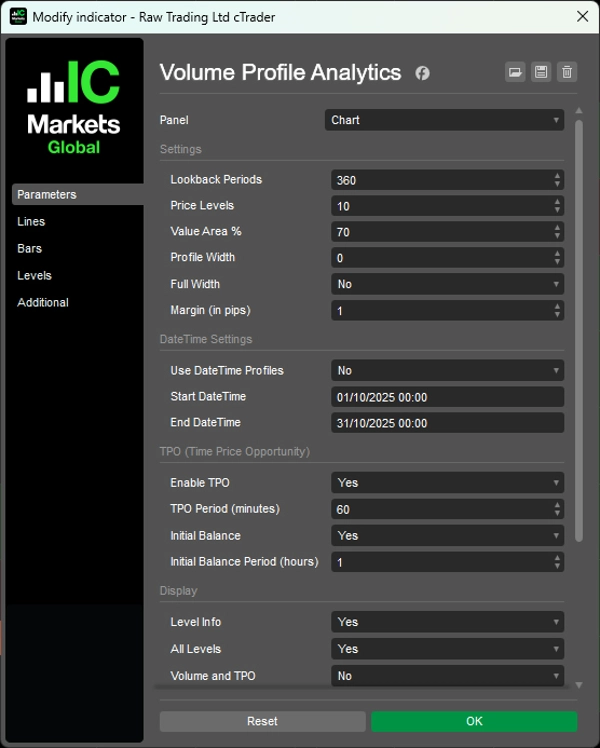
Sie können Lookback-Perioden wählen oder spezifische Datumsbereiche einstellen, Volumenbalken proportional oder in voller Breite anzeigen, zwischen allen Levels oder nur Schlüssel-Levels umschalten und Farben für bullishe/bearishe Aktivität anpassen.
FUNKTIONEN
Volumenverteilungsanalyse
- Point of Control (POC): Preisniveau mit der höchsten Aktivität—wo der Preis die meiste Zeit verbrachte
- Value Area (VA): Anpassbarer Aktivitätskonzentrationsbereich (Standard 70%)—wo der meiste Handel stattfand
- VAH/VAL: Value Area Hoch/Tief Grenzen—potenzielle Unterstützungs-/Widerstandsniveaus
- Delta-Visualisierung: Geteilte Balken zeigen Kerzenrichtung auf jedem Preisniveau
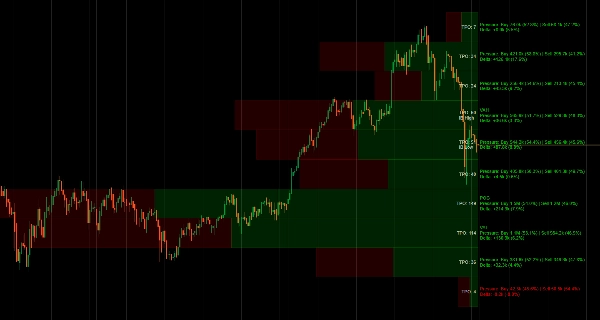
Market Profile TPO
- Time Price Opportunity Tracking: Zählt, wie viele Zeitperioden auf jedem Preis gehandelt wurden
- TPO-Buchstaben: Visuelle Darstellung der verbrachten Zeit am Preis (A-Z Sequenz)
- Initial Balance (IB): Bereich der ersten Stunde—wichtig für Tageshandelsstruktur
- IB Hoch/Tief Markierungen: Eröffnungsbereich-Extrema
Flexible Lookback-Optionen
- Periodenbasiert: Anzahl der zu analysierenden Bars einstellen (z.B. letzte 120 Bars)
- DateTime-Bereich: Profil zwischen bestimmten Daten/Zeitpunkten für Ereignisanalyse verankern
- Dynamische Breite: Automatische Skalierung oder feste Breite der Profile
Anzeigeoptionen
- Volumenbalken: Proportionale Breite (aktivitäts-skalierte) oder volle Breite einheitliche Balken
- Kerzenrichtungsaufteilung innerhalb jedes Balkens
- Delta-Berechnungen mit Prozentangaben
- Umschalten zwischen allen Levels oder nur Schlüssel-Levels (POC, VAH, VAL)
- Sichtbarkeitskontrolle für Volumen/TPO-Details
- Richtungsaufteilung mit Prozentangaben
- Anpassbare Schriftgröße und pip-basierte Ränder
Farb-Anpassung
- Unabhängige Farben für bullishe/bearishe Richtungsbalken
- Getrennte Textfarben für positive/negative Delta
- TPO-spezifische Textfarbe
Leistungsoptimiert
- Zwischengespeicherte Zeit-Lookups und effizientes Rechteckzeichnen
- Minimale Neuberechnung für flüssige Leistung
- Professionelle Delta-Berechnung basierend auf Kerzenstruktur
__________________________________________________________________________________________
MEHR KOSTENLOSE INDIKATOREN
Entdecken Sie eine breite Palette von Marktanalysetools – von Struktur und Volumen bis Regression, Volatilität und benutzerdefinierten Zeitrahmen.
Quellcode ist auf GitHub Repository verfügbar.
Alle kostenlos nutzbar. Aber wenn Sie Lust haben, eine Kaffee-Unterstützung zu senden, können Sie sie hierhinleiten.
Support/Widerstand
Volumen
- Volumen-Aktivitätsprofiler
- Volumen-Effizienz-Analysator
- Volumenprofil-Analyse
- Volumenprofil - Aktualisiert
- Volumen Spread Analyse
- VWAP (Volumen-Gewichteter Durchschnittspreis)
Gleitende Durchschnitte
- Verankerter gleitender Durchschnitt
- Abweichungsskaliertes gleitendes Mittel
- Instantane Trendlinie
- Kaufman Adaptive MA mit Trend Vision
- Gleitender Durchschnittskanal
- Gleitende Durchschnitte Suite
- Trendkanal gleitender Durchschnitt
Dienstprogramme/Benutzerdefiniert
Regressionsbasiert
Volatilität
Oszillatoren
__________________________________________________________________________________________
HAFTUNGSAUSSCHLUSS
Handel birgt Risiken. Dieser Indikator ist nur für die technische Analyse gedacht — wenden Sie stets ein angemessenes Risikomanagement an und handeln Sie verantwortungsbewusst.
FEEDBACK & VERBESSERUNGEN
Wenn Sie Vorschläge, Funktionswünsche oder Ideen zur Verbesserung haben, hinterlassen Sie bitte einen Kommentar im Diskussions-Tab. Ihr Feedback hilft, den Indikator für alle zu verbessern.
Zusammenfassung
Users can customize lookback periods by number of bars or specific date/time ranges and choose between proportional or full-width volume bars. The indicator also provides delta visualization, splitting tick activity by candle direction with percentage breakdowns, and offers extensive display and color customization options for bullish and bearish activity.
This tool is optimized for performance with cached calculations and efficient drawing methods. It is designed to measure market activity rhythm and tempo based on tick volume, which counts price changes but does not represent actual traded money or liquidity. It is suitable for analyzing volume distribution and market structure across various trading sessions and timeframes.
Kundenbewertungen
5 | 100 % | |
4 | 0 % | |
3 | 0 % | |
2 | 0 % | |
1 | 0 % |