
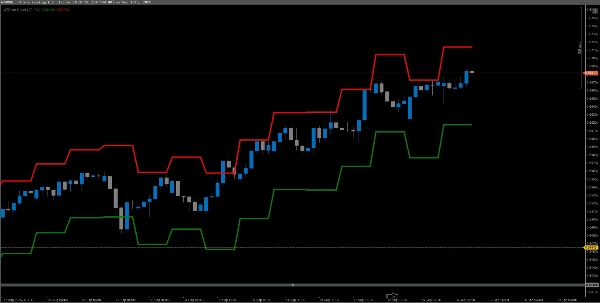
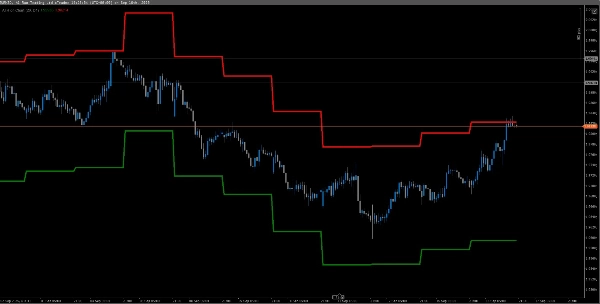
ATR on Chart
Indikator
250 downloads
Version 1.0, Sep 2025
Windows, Mac
Beschreibung
Zeigt die durchschnittliche wahre Spanne an. Zeichnet den ATR im Diagramm zur einfachen Visualisierung, der Standardzeitrahmen ist täglich, kann aber geändert werden.
Zusammenfassung
Indikatorprofil
Kundenbewertungen
0.0
Bewertungen: 0
Kundenbewertungen
Bisher gibt es keine Bewertungen für dieses Produkt. Haben Sie es schon ausprobiert? Dann können Sie die erste Person sein, die andere darüber informiert!
Diskussion
Häufig gestellte Fragen (FAQ)
BTCUSD
Forex
Signal
Indices
EURUSD
Commodities
GBPUSD
Crypto
XAUUSD
ATR
USDJPY
Über den cTrader Store verfügbare Produkte, einschließlich Handelsbots, Indikatoren und Plugins, werden von externen Entwicklern bereitgestellt und nur zu Informations- und technischen Zugriffszwecken verfügbar gemacht. cTrader Store ist kein Broker und erbringt keine Anlageberatung, persönlichen Empfehlungen oder eine Garantie für zukünftige Performance.


Preis
Seit 11/09/2025
250
Kostenlose Installationen