
설명
The Cup Finder:
I는 유클리드 기하학과 밀도 기반 검증을 사용하여 일반적으로 "컵" 및 "역컵"으로 알려진 둥근 가격 구조를 식별하고 검증하도록 설계된 고정밀 기술 지표입니다.
📊 시장 분석 및 조건
https://chartshots.spotware.com/c/6980ec8b2ee38
이 지표는 특정 과거 조회 기간 내의 고가 및 저가 피벗을 분석합니다. 특히 다음을 찾습니다:
- 가격 곡률: 잠재적 패턴의 "앵커"를 설정하기 위해 지역 최고점 또는 최저점(30봉 창)을 식별합니다.
- 기하학적 경로: 앵커와 현재 가격 사이에 수학적 반원 호를 투영합니다.
- 밀도 검증: 시각적 도구와 달리, 호 주변의 특정 가격 채널 내에 최소한의 봉 비율(내용 비율)이 머물렀는지 계산합니다.
🟢 신호 및 시각적 해석 방법
https://chartshots.spotware.com/c/6980ed1a2d9e9
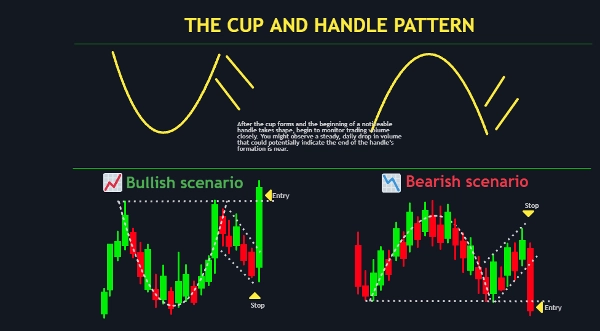
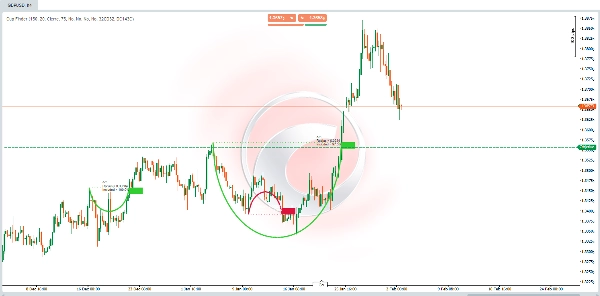
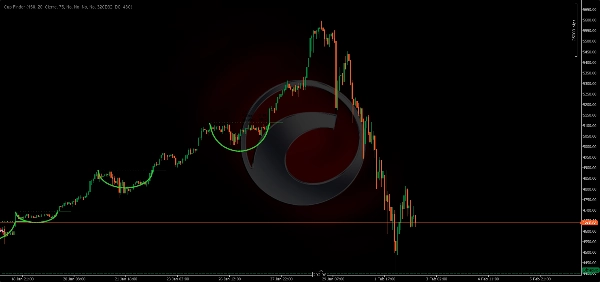
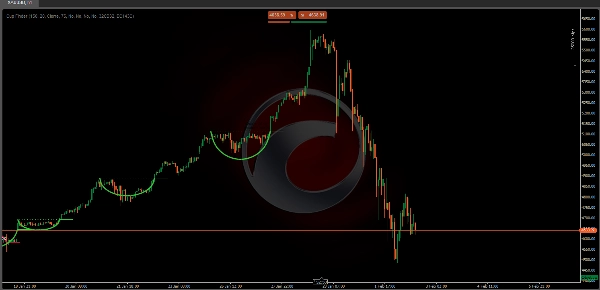
- 녹색 호(강세): 둥근 바닥 형성을 나타냅니다. 저항 "림" 수준을 나타내는 수평 점선을 찾으세요.
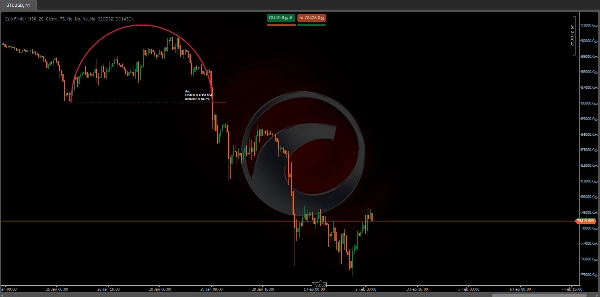
- 빨간색 호(약세): 둥근 천장(볼트) 형성을 나타냅니다. 관찰할 지지 수준을 표시하는 수평 점선이 있습니다.
- 정보 레이블:
-
- 반경: 가격 단위로 패턴의 깊이를 보여줍니다.
- 포함 비율 %: "기하학적 정확도" 점수입니다. 비율이 높을수록 가격이 곡선을 더 엄격하게 따랐음을 의미합니다.
⚙️ 주요 설정 및 매개변수
- 검색 기간(기본값: 150): 알고리즘이 유효한 과거 앵커를 찾기 위해 스캔하는 봉 수입니다.
- 채널 진폭(기본값: 20): 호 검증 영역의 "두께"를 정의합니다. 값이 높을수록 가격 노이즈에 대해 더 관대합니다.
- 내용 비율 % (기본값: 75): 표시되기 위해 호 내부에 머물러야 하는 최소 봉 비율입니다.
- 돌파 소스: 패턴이 종가 또는 고가/저가가 림 라인을 넘는지 여부를 선택합니다.
🚀 일반적인 사용 사례 및 시나리오
https://chartshots.spotware.com/c/6980eefccbe38
- 돌파 매매: 가격이 수평 점선(림) 위/아래로 돌파하고 종가가 형성될 때 거래에 진입합니다.
- 추세 반전 식별: 하락 추세 끝의 "둥근 바닥" 또는 상승 추세 끝의 "둥근 천장"을 포착합니다.
- 구조적 지지/저항: 스톱 로스 설정이나 이익 실현을 위한 주요 수준으로 림 라인을 사용합니다.
👤 대상 트레이더 프로필
- 가격 행동 트레이더: 시장 기하학과 구조적 소진을 찾는 사람들.
- 체계적 트레이더: 수작업으로 "컵"을 그리는 주관성을 제거하고 수학적 확인을 선호하는 사용자.
- 경험 수준: 돌파 확인 및 지지/저항 개념을 이해하는 중급에서 고급 트레이더에게 적합합니다.
⚠️ 중요한 제한 사항 및 사용 주의
- 최소 필요 이력: 이 지표는 내부 계산을 초기화하기 위해 최소 292봉의 데이터가 필요합니다.
- 후행 특성: 과거 데이터를 기반으로 곡선을 검증하기 때문에 "둥근" 형성이 상당히 진행된 후에만 호가 나타납니다.
- 재도색/업데이트: 가격이 진행됨에 따라 호가 반경을 조정하거나 "포함 %"가 임계값 이하로 떨어지면 사라질 수 있습니다.
요약
AI 요약
Cup Finder is a technical indicator designed to identify and validate rounding price patterns known as "Cups" and "Inverted Cups" using Euclidean geometry and density-based validation. It analyzes high and low price pivots over a historical lookback period to detect price curvature by identifying local peaks or troughs within a 30-bar window, establishing an anchor point for potential patterns. The indicator projects a semicircular arc between this anchor and the current price and calculates a content rate to confirm that a minimum percentage of bars remain within a defined price channel around the arc.
Visual signals include green arcs indicating bullish rounding bottoms with a horizontal dotted resistance line, and red arcs indicating bearish rounding tops with a support line. Information labels display the pattern's radius and geometric accuracy percentage. Key adjustable parameters include search period, channel amplitude, content rate threshold, and breakout source (close or high/low crossing the rim line).
Typical use cases involve breakout trading, trend reversal identification, and defining structural support or resistance levels. The indicator targets intermediate to advanced price action and systematic traders seeking mathematical confirmation of rounding patterns. It requires at least 292 bars of historical data and may repaint or update arcs as price evolves. Supported markets include Forex, stocks, commodities, indices, and cryptocurrencies such as BTCUSD, EURUSD, GBPUSD, and XAUUSD.
지표 프로필
고객 리뷰
0.0
리뷰: 0
고객 리뷰
이 상품에 대한 리뷰가 아직 없습니다. 이미 사용해 보셨나요? 다른 사람들에게 가장 먼저 소개해 주세요!
상담
자주 묻는 질문(FAQ)
BTCUSD
Forex
Breakout
Indices
EURUSD
Commodities
GBPUSD
NZDUSD
Prop
Crypto
Stocks
XAUUSD
NAS100
USDJPY
트레이딩 봇, 지표, 플러그인 등 cTrader Store에서 제공되는 상품은 제3자 개발자에 의해 제공되며, 이는 단순히 정보 및 기술적 접근을 목적으로 제공된 것입니다. cTrader Store는 중개인이 아니며, 투자 조언, 개인별 추천 또는 향후 성과에 대한 어떠한 보장도 제공하지 않습니다.


가격
가입일 03/10/2024
163
판매
38.54K
무료 설치