
설명
📈 cTrader용 Divergency v1.1 지표: 종합 가이드 🚀
이 Divergency v1.1 지표는 가격 움직임과 다양한 오실레이터 간의 다이버전스 및 상관관계를 식별하기 위해 cTrader 플랫폼용으로 설계된 강력한 도구입니다. 이 가이드는 코드, 기능 및 효과적인 사용법에 대한 단계별 설명을 제공합니다. 초보자든 경험 많은 트레이더든, 이 지표는 사용자 정의 가능한 설정과 시각적 신호로 기술적 분석을 향상시킬 수 있습니다. 시작해 봅시다! 🌟
🎯 Divergency11 지표 개요
이 Divergency v1.1 지표는 가격 움직임과 오실레이터 동작을 분석하여 다음을 감지합니다:
- 일반 다이버전스: 가격과 지표가 반대 방향으로 움직일 때 잠재적 반전을 신호합니다.
- 숨겨진 다이버전스: 가격과 지표가 다르게 정렬될 때 추세 지속을 나타냅니다.
- 상관관계: 가격과 지표가 동기화되어 움직일 때 추세 강도를 강조합니다.
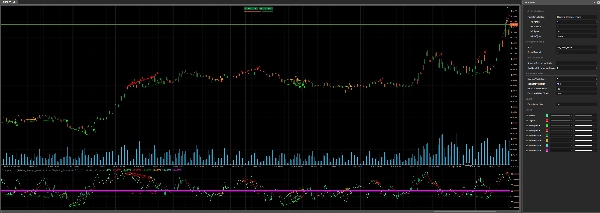
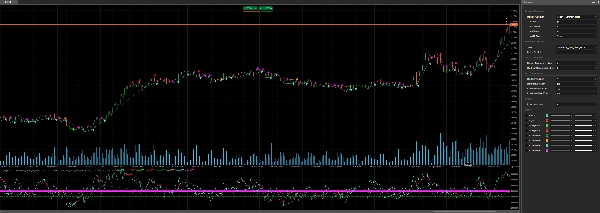
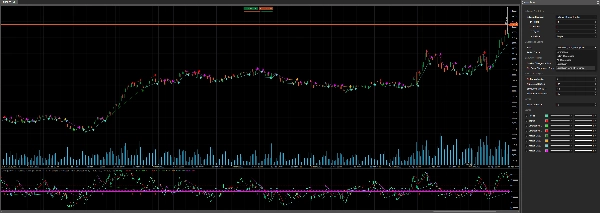
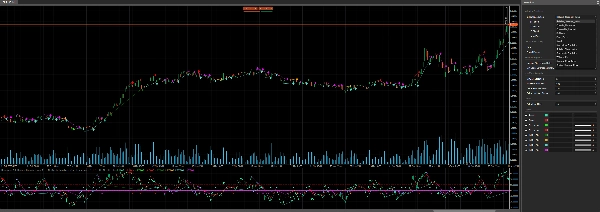
이 지표는 12가지 다양한 오실레이터(예: RSI, MACD, Stochastic)를 지원하며, 다이버전스 감지 매개변수를 사용자 정의할 수 있어 다양한 거래 전략에 적합합니다. 지표는 차트 및 지표 영역에 신호를 직접 표시하며, 컬러 라인, 아이콘 및 텍스트를 사용해 명확한 시각화를 제공합니다. 📊
🔍 코드 분석
1. 지표 설정 🛠️
- 네임스페이스 및 클래스:
cAlgo네임스페이스에Divergency v1.1로 정의되며Indicator를 상속합니다. - 속성:
-
IsOverlay = false: 별도의 지표 창에 표시됩니다.TimeZone = TimeZones.UTC: 일관성을 위해 UTC를 사용합니다.AccessRights = AccessRights.None: 특별 권한이 필요 없습니다.
2. 매개변수 ⚙️
이 지표는 명확성을 위해 그룹화된 매개변수를 통해 광범위한 사용자 정의를 제공합니다:
- 오실레이터 선택:
-
IndicatorSelection: 12가지 오실레이터 중 선택 (예: RSI, MACD, Stochastic). (중간값 50으로 정규화되며 최적화 과정에서 더 높은 결과)Value1,Value2,Value3: 기간, 평활화, 신호선 설정 조정.MaType: 이동평균 유형 선택 (예: 단순, 지수).
- 다이버전스 설정:
-
Strat: 감지 모드 선택 (다이버전스, 숨겨진 다이버전스, 상관관계 또는 조합).PeriodFractal: 피크/저점 식별을 위한 프랙탈 기간 설정 (홀수여야 함).LookBack: 분석할 과거 다이버전스 수.MinCountDivergenceShow: 신호 표시를 위한 최소 다이버전스 수.
- 영역 분석:
-
MinBarsValidation,MaxBarsValidation: 다이버전스 감지를 위한 유효 바 범위 정의.ExtraLevelMin,ExtraLevelMax: 오실레이터 과매수/과매도 임계값 설정.
- 레벨:
-
ExtraLevelLine: 50 레벨 주변의 과매도/과매수 라인 조정.
3. 출력 📈
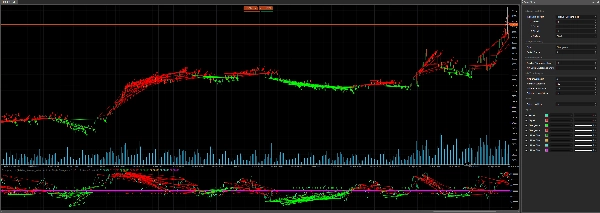
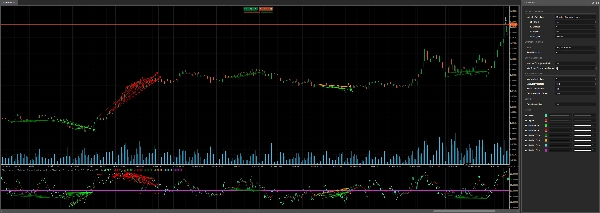
Result: 주요 오실레이터 값 (녹색 선).Signal: 평활화된 신호선 (빨간 선).- 다이버전스 신호 (포인트로 표시):
-
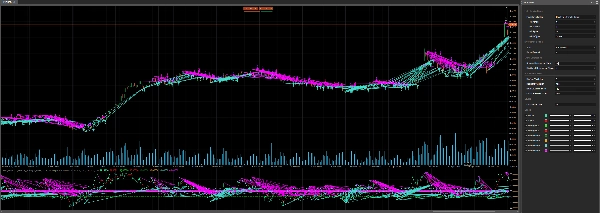
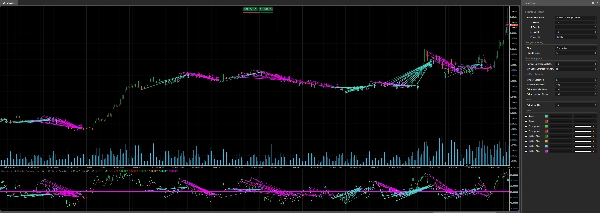
ResDivergenceUp(라임),ResDivergenceDown(빨강): 일반 다이버전스.ResDivergenceUpHidden(초록),ResDivergenceDownHidden(주황): 숨겨진 다이버전스.ResCorrelationUp(청록),ResCorrelationDown(마젠타): 상관관계.
4. 주요 함수 🧠
- Initialize(): 지표를 설정하고, 매개변수를 검증하며, 정적 라인(과매도, 과매수, 0)을 그립니다.
- Calculate(): 오실레이터 값을 계산하고 50을 중심으로 정규화하며, 다이버전스 분석을 위한 프랙탈을 감지합니다.
- GetFractal(): 오실레이터에서 피크(fractalUp)와 저점(fractalDown)을 식별합니다.
- GetDivergence(): 프랙탈 포인트를 분석하여 다이버전스 또는 상관관계를 감지합니다.
- CreateLine(): 감지된 신호에 대한 추세선과 아이콘을 그립니다.
- DawDivergence(): 차트와 지표 영역에 라인과 화살표로 다이버전스를 시각화합니다.
5. 도움 클래스 📋
SRPrice: 프랙탈 데이터(인덱스, 가격, 지표 값)를 저장합니다.DivergenceFind: 다이버전스 세부 정보(제목, 시간, 가격, 색상)를 추적합니다.
6. 오류 처리 🚨
이 지표는 잘못된 매개변수(예: MinBarsValidation > MaxBarsValidation, 짝수인 PeriodFractal)를 검사하고, DrawStaticText를 사용해 지표 영역에 경고를 표시합니다.
🛠️ Divergency11 지표 사용법
1단계: 설치 📥
- 코드 다운로드: 제공된 C# 코드를 복사합니다.
- cTrader에 추가:
-
- cTrader를 열고 cAlgo > Indicators로 이동합니다.
- New를 클릭하고 코드를 편집기에 붙여넣습니다.
- 지표를 빌드합니다 (컴파일 오류가 없는지 확인).
- 차트에 적용:
-
- cTrader에서 차트를 엽니다.
- 지표 목록에서 Divergency11 지표를 추가합니다.
2단계: 매개변수 구성 ⚙️
거래 스타일에 맞게 설정을 사용자 정의하세요:
- 오실레이터 선택:
-
- 예:
Relative_Strenght_Index(RSI)와 같은 오실레이터를IndicatorSelection을 통해 선택합니다. - 필요에 따라
Value1(기간),Value2(평활화),Value3(신호 기간)를 조정합니다.
- 예:
- 다이버전스 유형 설정:
-
Strat을 사용하여Divergence,Hiden_Divergence,Correlation또는All_Divergence에 집중합니다.
- 프랙탈 및 룩백:
-
- 대칭을 위해 홀수(예: 5)로
PeriodFractal을 설정합니다. - 분석할 과거 다이버전스 수를 제어하기 위해
LookBack을 조정합니다.
- 대칭을 위해 홀수(예: 5)로
- 영역 및 레벨:
-
- 과매수/과매도 영역을 위해
ExtraLevelMin및ExtraLevelMax를 구성합니다. - 시각적 임계값 조정을 위해
ExtraLevelLine을 설정합니다.
- 과매수/과매도 영역을 위해
3단계: 신호 해석 📊
- 일반 다이버전스:
-
- 상승 (라임): 약세 신호 (가격은 고점을 높이고, 오실레이터는 고점을 낮춤).
- 하락 (빨강): 강세 신호 (가격은 저점을 낮추고, 오실레이터는 저점을 높임).
- 숨겨진 다이버전스:
-
- 상승 (초록): 강세 지속 (가격은 고점을 낮추고, 오실레이터는 고점을 높임).
- 하락 (주황): 약세 지속 (가격은 저점을 높이고, 오실레이터는 저점을 낮춤).
- 상관관계:
-
- 상승 (청록): 강한 강세 추세 (가격과 오실레이터 모두 상승).
- 하락 (마젠타): 강한 약세 추세 (가격과 오실레이터 모두 하락).
- 시각적 신호:
-
- 추세선은 차트와 지표에서 다이버전스 포인트를 연결합니다.
- 화살표는 신호 방향(상승/하락)을 나타냅니다.
- 텍스트는 감지된 다이버전스 수를 표시합니다 (만약
LookBack > 1일 경우).
4단계: 거래 전략 💡
- 반전 거래:
-
- 일반 다이버전스 (라임/빨강)를 사용하여 잠재적 반전을 포착합니다.
- 다른 지표(예: 지지/저항, 캔들스틱 패턴)로 확인합니다.
- 추세 지속:
-
- 숨겨진 다이버전스 (초록/주황)는 추세 지속을 신호합니다.
- 풀백 후 추세 방향으로 거래에 진입합니다.
- 추세 강도:
-
- 상관관계 (청록/마젠타)는 강한 추세를 확인합니다.
- 반추세 거래를 피하기 위한 필터로 사용합니다.
- 타임프레임:
-
- 모든 타임프레임에서 작동하지만, 높은 타임프레임(H1, H4)이 노이즈를 줄입니다.
- 위험 관리:
-
- 최근 스윙 저점 아래(롱의 경우) 또는 스윙 고점 위(숏의 경우)에 스톱로스를 설정합니다.
- 포지션 크기를 조절하기 위해 ATR(코드에 포함됨)을 사용합니다.
5단계: 최적화 🔧
- 백테스트: cTrader의 백테스팅 기능을 사용하여 과거 데이터에서 지표를 테스트합니다.
- 매개변수 조정:
PeriodFractal,LookBack,MinCountDivergenceShow를 실험하여 잘못된 신호를 줄입니다. - 지표 결합: 이동평균과 같은 추세 지표 또는 볼린저 밴드와 같은 변동성 도구와 함께 사용합니다.
🌟 성공을 위한 팁
- 간단하게 시작하세요: 기본 설정과 익숙한 오실레이터(RSI 등)로 시작하세요.
- 데모에서 연습하세요: 데모 계좌에서 지표 신호를 테스트하여 이해하세요.
- 알림 모니터링: 화살표와 추세선을 주시하여 신호에 신속히 대응하세요.
- 과도한 거래 피하기: 다이버전스를 단독이 아닌 광범위한 전략의 일부로 사용하세요.
- 최신 상태 유지: cTrader 포럼에서 코드 업데이트나 커뮤니티 피드백을 확인하세요.
⚠️ 일반적인 문제 및 해결책
- 신호가 나타나지 않음:
-
MinCountDivergenceShow가LookBack보다 작거나 같은지 확인하세요.PeriodFractal가 홀수인지 확인하세요.
- 신호가 너무 많음:
-
MinCountDivergenceShow를 늘리거나LookBack를 줄이세요.MinBarsValidation와MaxBarsValidation을 엄격히 조정하세요.
- 오류 메시지:
-
- 지표 영역에서 매개변수 경고를 검토하세요 (예:
MinBarsValidation > MaxBarsValidation). - 잘못된 설정을 수정하고 지표를 다시 적용하세요.
- 지표 영역에서 매개변수 경고를 검토하세요 (예:
🎉 결론
이 Divergency v1.1 지표는 cTrader 사용자에게 가격과 오실레이터 관계에 대한 깊은 통찰을 제공하는 다재다능하고 견고한 도구입니다. 사용자 정의 가능한 설정과 명확한 시각적 출력으로 트레이더가 반전, 지속, 추세 강도를 자신 있게 포착할 수 있도록 도와줍니다. 직접 사용해 보고 매개변수를 조정하며 거래 계획에 통합하여 분석 수준을 높이세요! 🚀
행복한 거래 되시고, 차트가 항상 푸르길 바랍니다! 📈💚
요약
- Regular divergences signaling potential reversals when price and oscillator move oppositely.
- Hidden divergences indicating trend continuation with differing price and oscillator alignments.
- Correlations highlighting synchronized movements suggesting trend strength.
Signals are displayed on the chart and indicator window using colored lines, icons, and text for clarity. Visual cues include trend lines connecting divergence points and arrows indicating signal direction. Key functions handle initialization, calculation of normalized oscillator values, fractal detection, divergence analysis, and drawing of signals.
Users can configure overbought/oversold zones and adjust lookback periods to tailor signal sensitivity. The indicator works on any timeframe, with higher timeframes recommended to reduce noise. It includes error handling for invalid parameters and provides guidance for installation, parameter setup, signal interpretation, and trading strategies such as reversal and trend continuation. Backtesting and parameter optimization are supported within cTrader to refine performance.
고객 리뷰
5 | 100 % | |
4 | 0 % | |
3 | 0 % | |
2 | 0 % | |
1 | 0 % |


