Beschreibung
AKTUALISIERTE VERSION VERFÜGBAR HIER
Suchen Sie mehr als nur native Zeitrahmen-Overlays? Der aktualisierte Custom Timeframes Indikator erweitert dieses Konzept mit leistungsstarken Ergänzungen:
- Nicht-standardmäßige Perioden (5H, 7H, 9H-23H, 25m, 35m, 50m, 55m, 4-Tage, 2-Wochen, 3-Wochen, mehrere Monate, mehrere Jahre)
- OHLC-Linien mit Balkenversatzsteuerung für abgeschlossene oder sich bildende Balken
- Sieben Fibonacci-Niveaus (11,4% bis 88,6%) mit Hervorhebung der Gleichgewichtszone
- Gleitende Durchschnitte direkt auf der Struktur des benutzerdefinierten Zeitrahmens berechnet (9 MA-Typen, 8 Preisquellen)
- Umschaltknöpfe für schnelle Funktionsverwaltung.
Wenn Sie Perioden zwischen den Standard-Chart-Intervallen mit vollständiger technischer Analyse-Überlagerung benötigen, sehen Sie sich die aktualisierte Version an.
__________________________________________________________________________________________
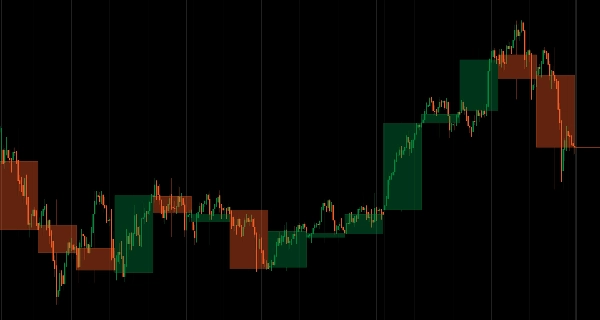
Überlagern Sie Echtzeit-HTF-Kerzen auf jedem Chart, ohne die Zeitrahmen zu wechseln.
Zeigt die Kerzenstruktur höherer Zeitrahmen (Körper und Dochte) direkt auf Charts niedrigerer Zeitrahmen mit Live-Updates, während sich die Periode entwickelt.
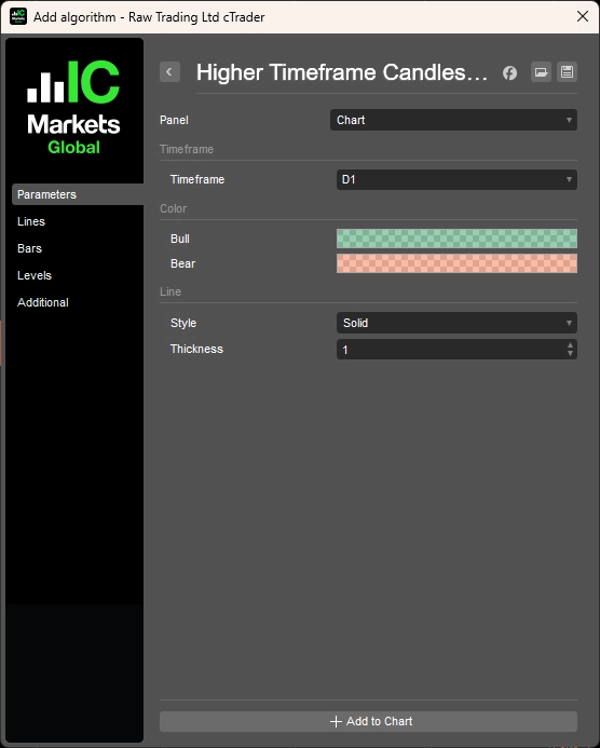
Flexible Zeitrahmen-Auswahl (Täglich auf H1, Wöchentlich auf H4, Monatlich auf Täglich), farbcodierte Bullen-/Bären-Tendenz (grün/rot), anpassbarer Linienstil und Transparenz sowie leichte Performance bieten kontinuierlichen HTF-Kontext für Trader, die die Struktur über mehrere Zeitrahmen hinweg überwachen, ohne den Chart zu wechseln.
EIGENSCHAFTEN
Flexible Zeitrahmen-Auswahl
- Jeder HTF: Täglich auf H1, Wöchentlich auf H4, Monatlich auf Täglich – Ihre Wahl
- Echtzeit-Updates: HTF-Kerze wird neu gezeichnet, während die Periode fortschreitet
- Immer im Blick: Handeln Sie niedrigere Zeitrahmen, während Sie den Kontext höherer Zeitrahmen beibehalten
Visuelle Klarheit
- Farbcodiert: Bulle (grün), Bär (rot) – sofortige Tendenzbestätigung
- Anpassbar: Linienstil, Dicke, Transparenz
- Saubere Darstellung: Körper und Dochte klar angezeigt
Einfache Integration
- Kein Wechsel des Zeitrahmens erforderlich
- Erhält den Chart-Kontext, während die HTF-Struktur angezeigt wird
- Leichtgewichtig und performance-optimiert
__________________________________________________________________________________________
MEHR KOSTENLOSE INDIKATOREN
Entdecken Sie eine breite Palette von Marktanalysetools – von Struktur und Volumen bis hin zu Regression, Volatilität und benutzerdefinierten Zeitrahmen.
Der Quellcode ist im GitHub Repository verfügbar.
Alle kostenlos nutzbar. Wenn Sie jedoch Kaffee-Unterstützung senden möchten, können Sie dies hier tun.
Unterstützung/Widerstand
Volumen
- Volumen-Aktivitätsprofiler
- Volumen-Effizienz-Analysator
- Volumenprofil-Analyse
- Volumenprofil - Aktualisiert
- Volumen-Spread-Analyse
- VWAP (Volumen-gewichteter Durchschnittspreis)
Gleitende Durchschnitte
- Verankerter gleitender Durchschnitt
- Abweichungsskaliertes gleitendes Mittel
- Instantane Trendlinie
- Kaufman Adaptive MA mit Trend Vision
- Gleitender Durchschnittskanal
- Gleitende Durchschnitte Suite
- Trendkanal gleitender Durchschnitt
Dienstprogramme/Benutzerdefiniert
Regressionsbasiert
Volatilität
Oszillatoren
__________________________________________________________________________________________
HAFTUNGSAUSSCHLUSS
Der Handel birgt Risiken. Dieser Indikator ist nur für die technische Analyse gedacht – wenden Sie stets ein angemessenes Risikomanagement an und handeln Sie verantwortungsbewusst.
FEEDBACK & VERBESSERUNGEN
Wenn Sie Vorschläge, Funktionswünsche oder Ideen zur Verbesserung haben, hinterlassen Sie bitte einen Kommentar im Diskussions-Tab. Ihr Feedback hilft dabei, den Indikator für alle zu verbessern.