
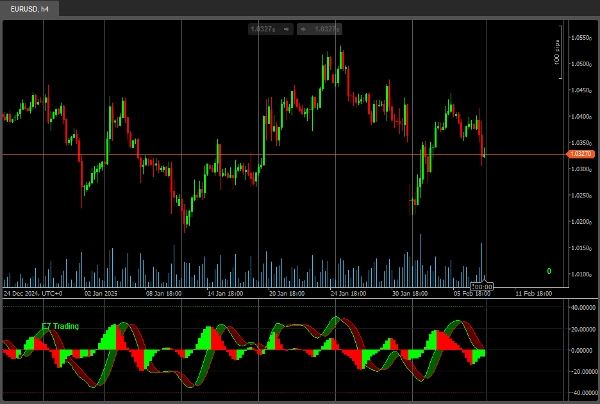
E7 Indicators Free Studies
Wskaźnik
191 pobrania
Wersja 1.0, Feb 2025
Windows, Mac
Opis
Wskaźniki E7 Free Studies obejmują tylko następujące
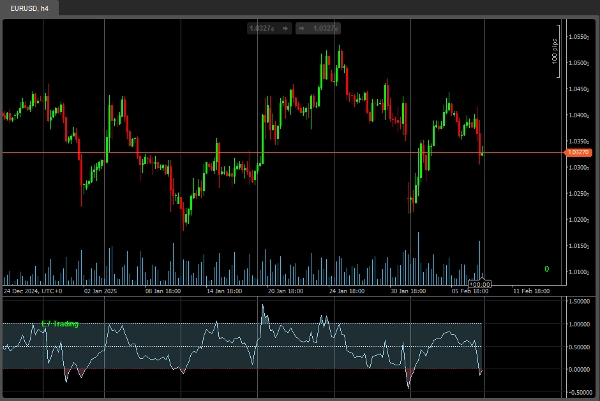
- ADXR
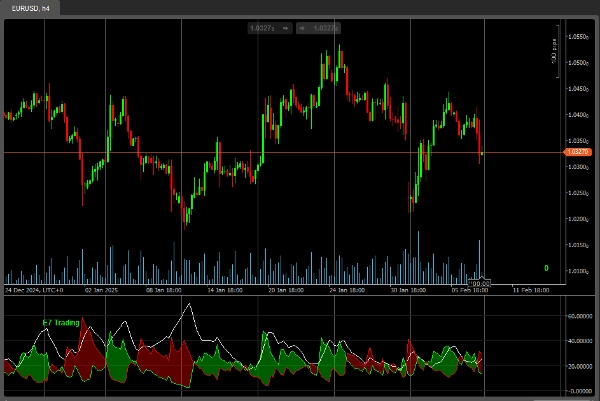
- AEOscillator
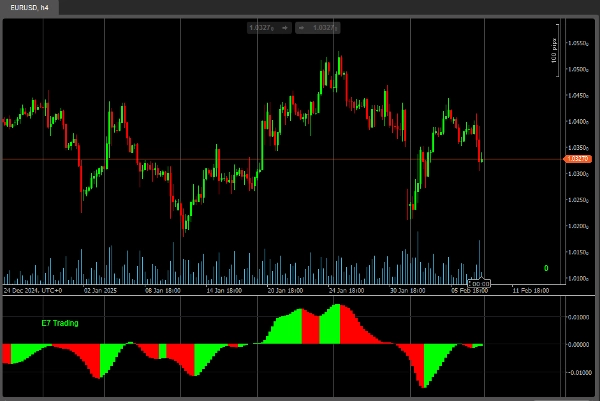
- Zmienność wstęgi Bollingera
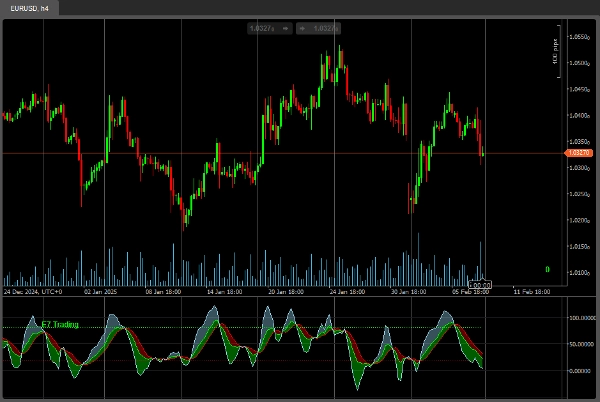
- KDJ
- Fala sinusoidalna
Udanych łowów!
Podsumowanie
Podsumowanie AI
E7 Indicators Free Studies is a collection of technical analysis indicators designed for use in trading platforms. It includes five specific studies: ADXR, AEOscillator, Bollinger Band Volatility, KDJ, and Sine Wave. These indicators provide various methods to analyze market trends, momentum, volatility, and cyclical price movements. The product supports application across different markets where these indicators are relevant. Each indicator offers distinct analytical insights, such as trend strength (ADXR), oscillator-based momentum (AEOscillator), volatility measurement (Bollinger Band Volatility), stochastic momentum (KDJ), and cyclical wave patterns (Sine Wave). This set is intended to assist traders in technical analysis by providing multiple complementary tools within a single package.
Profil wskaźnika
Opinie klientów
0.0
Opinie: 0
Opinie klientów
Ten produkt nie ma jeszcze opinii. Wypróbowałeś(-aś) go już? Bądź pierwszy(-a) i powiedz o tym innym!
Dyskusja
Częste pytania
Bollinger
Produkty dostępne za pośrednictwem cTrader Store, w tym boty handlowe, wskaźniki i wtyczki, dostarczane są przez deweloperów zewnętrznych i udostępniane wyłącznie w celach informacyjnych oraz w celu zapewnienia dostępu technicznego. cTrader Store nie jest brokerem i nie zapewnia doradztwa inwestycyjnego, nie udziela spersonalizowanych rekomendacji ani nie gwarantuje przyszłych wyników.
Więcej od tego autora


Cena
Od 18/12/2024
2
Sprzedaż
4.27K
Bezpłatne instalacje