Cumulative Delta_noSourceCode
Indicador
349 descargas
Versión 1.0, Feb 2025
Windows, Mac
Descripción
Resumen
Resumen de IA
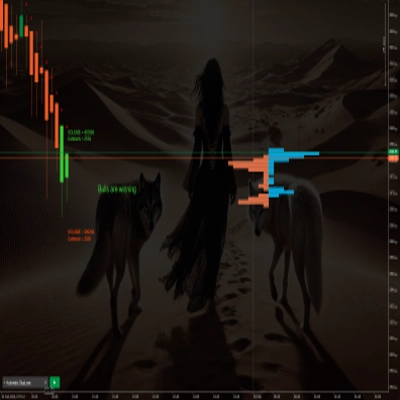
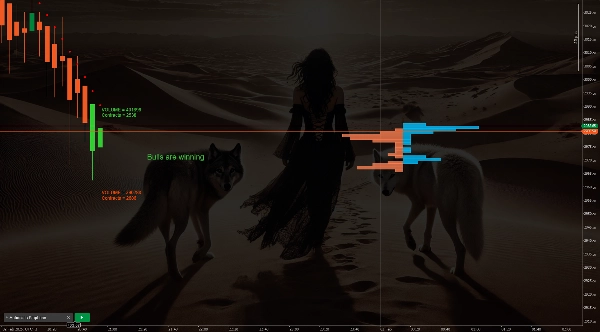
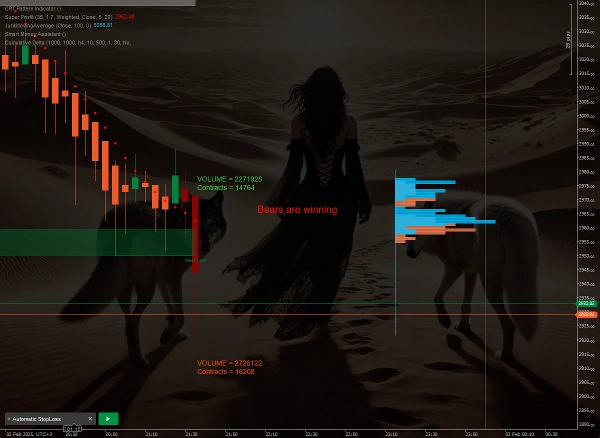
The Cumulative Delta_noSourceCode indicator displays the number of contracts and volume traded per candle on a trading chart. Each candle changes color based on the cumulative delta value for that candle, providing a visual representation of buying and selling pressure. Additionally, the indicator includes a small volume profile for each candle, offering detailed insight into volume distribution within the candle. This tool can help users identify market manipulation patterns by analyzing volume and delta shifts across candles.
Perfil del indicador
Valoraciones de clientes
0.0
Valoraciones: 0
Valoraciones de clientes
Este producto todavía no se ha valorado. ¿Ya lo ha probado? Sea el primero en informar a otros.
Conversación
Preguntas frecuentes
Los productos disponibles a través de cTrader Store, incluidos bots, indicadores y plugins para operar, son proporcionados por desarrolladores de terceros y están disponibles únicamente con fines informativos y de acceso técnico. cTrader Store no es un bróker, por lo que no proporciona asesoramiento de inversión, recomendaciones personales ni ninguna garantía de rentabilidad futura.


Precio
Desde 09/01/2025
11.78K
Instalaciones gratis