
ADX and ADI
Indikator
258 unduhan
Versi 1.0, Aug 2025
Windows, Mac
5.0
Ulasan: 2
Fitur Utama:
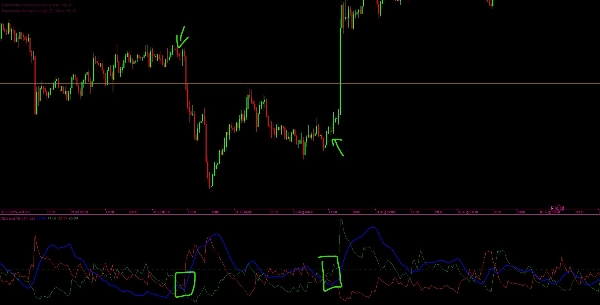
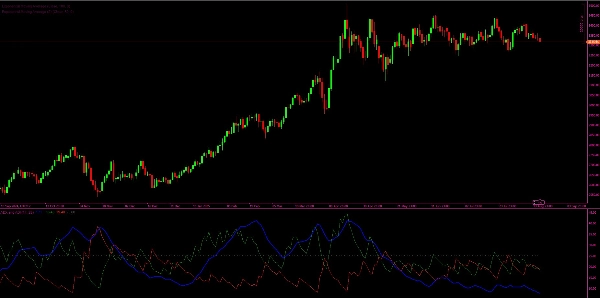
- Garis ADX dan ADI (Biru): Menunjukkan kekuatan tren saat ini yang telah dihaluskan, tanpa memandang arah.
- Garis +DI (Hijau): Menunjukkan kekuatan pergerakan naik.
- Garis -DI (Merah): Menunjukkan kekuatan pergerakan turun.
- Garis Ambang (Abu-abu): Sebuah level referensi horizontal (default 25) untuk membantu mengidentifikasi apakah kekuatan tren signifikan.
Cara Kerja:
- Indikator menghitung True Range (TR), Positive Directional Movement (+DM), dan Negative Directional Movement (-DM).
- Menggunakan teknik penghalusan Wilder untuk menghitung nilai yang dihaluskan dari TR, +DM, dan -DM.
- Dari sini, Indikator Directional (+DI dan -DI) diturunkan, menunjukkan sisi mana (bullish atau bearish) yang memiliki momentum lebih kuat.
- DX (Directional Index) dihitung dari perbedaan relatif antara +DI dan -DI.
- Akhirnya, ADX (Average Directional Index) dihitung sebagai versi yang dihaluskan dari DX, memberikan ukuran kekuatan tren secara keseluruhan.
Interpretasi:
- Ketika ADX berada di atas ambang (misalnya, 25), pasar dianggap sedang tren kuat.
- Ketika +DI > -DI, para bulls menguasai (tren naik).
- Ketika -DI > +DI, para bears menguasai (tren turun).
- Ketika ADX berada di bawah ambang, pasar dianggap sedang bergerak menyamping (tren lemah atau tidak ada tren).
Profil indikator
5.0
Ulasan: 2
5 | 100 % | |
4 | 0 % | |
3 | 0 % | |
2 | 0 % | |
1 | 0 % |
Ulasan pelanggan
December 1, 2025
ADX and ADI delivers clean trend strength and direction signals. ADX shows when the market is actually trending, while +DI and -DI reveal who’s in control. Stable, lightweight and reliable across all timeframes. Best on H1+ for smoother signals. Alerts and zone-highlighting would be great additions.
September 12, 2025
Produk-produk yang tersedia melalui cTrader Store, termasuk bot trading, indikator, dan plugin, disediakan oleh pengembang pihak ketiga serta hanya ditujukan untuk akses teknis dan informasi. cTrader Store bukan broker dan tidak menyediakan saran investasi, rekomendasi pribadi, atau jaminan apa pun tentang kinerja di masa mendatang.


Sejak 21/02/2025
466.3M
Volume trading
180.83K
Pip dimenangkan
21
Penjualan
6.77K
Instal gratis