
Levels
Indicador
175 transferências
Versão 1.0, Jan 2026
Windows, Mac
Descrição
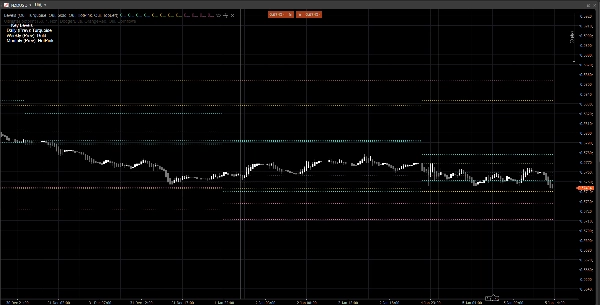
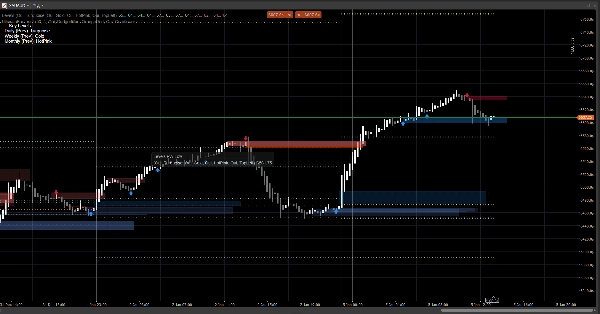
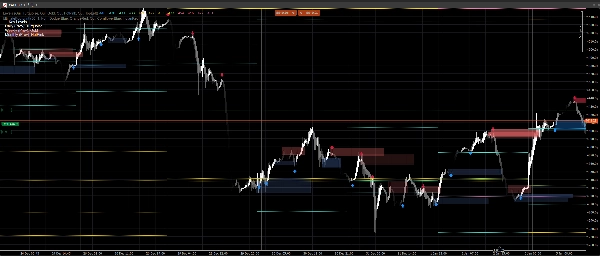
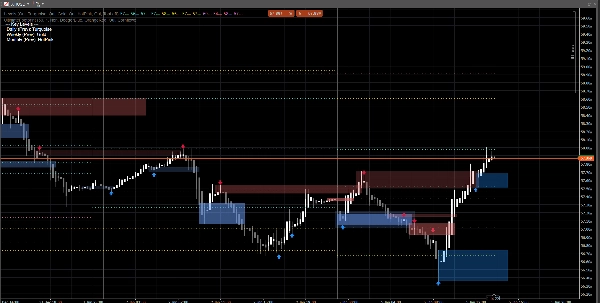
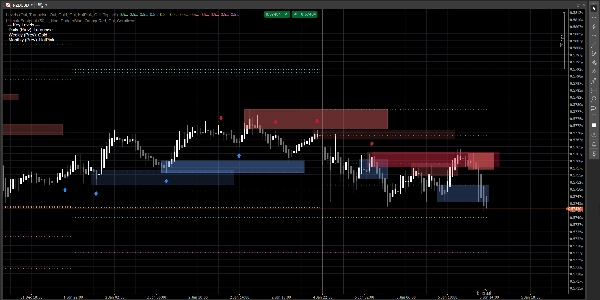
Zonas de Ação de Preço é um indicador leve e sem ruído que plota os níveis-chave Diários, Semanais e Mensais anteriores diretamente no seu gráfico.
Ele exibe:
- Dia Anterior: Máxima / Mínima / Abertura / Fechamento
- Semana Anterior: Máxima / Mínima / Abertura / Fechamento
- Mês Anterior: Máxima / Mínima / Abertura / Fechamento
Esses níveis são amplamente usados como zonas de reação, referências de liquidez e âncoras de contexto para estrutura de mercado, entradas, alvos e posicionamento de risco.
Por que é útil
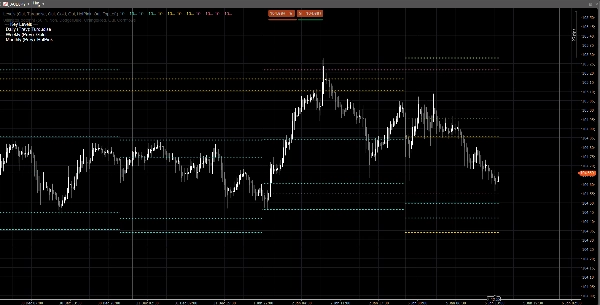
- Veja instantaneamente níveis de referência de prazos maiores sem trocar de gráfico
- Ajuda a enquadrar a ação de preço intradiária em torno de PDH/PDL, PWH/PWL, PMH/PML
- Visual limpo: os níveis permanecem constantes para a sessão/semana/mês atual
- Funciona em qualquer símbolo e período de tempo
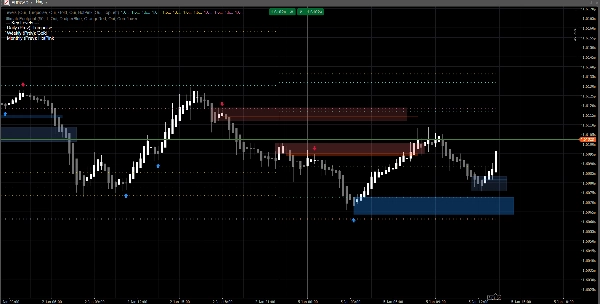
Personalização
Você pode ativar ou desativar independentemente cada período de tempo:
- Mostrar Diário / Semanal / Mensal
- Defina uma cor personalizada para cada grupo
- Habilite uma legenda simples, com posicionamento de canto selecionável
Notas técnicas
- Os níveis são calculados usando a vela diária/semanal/mensal anterior completa (não a que está se formando no momento).
- Isso evita repintura e mantém os níveis estáveis durante a sessão.
Aviso legal
Este indicador é fornecido apenas para suporte gráfico e de decisão. Ele não gera sinais de compra/venda e não é aconselhamento financeiro. Sempre gerencie o risco e valide com seus próprios dados.
Os sinais no gráfico são gerados pelo indicador Ultimate Footprint disponível no meu perfil.
Resumo
Perfil do indicador
Avaliações de clientes
0.0
Avaliações: 0
Avaliações de clientes
Ainda não há avaliações para este produto. Já o experimentou? Seja o primeiro a contar a outras pessoas!
Conversa
Perguntas frequentes
Prop
Forex
Indices
Commodities
Crypto
Stocks
Os produtos disponíveis através da cTrader Store, incluindo bots de negociação, indicadores e plugins, são fornecidos por programadores terceiros e são disponibilizados apenas para fins informativos e de acesso técnico. A cTrader Store não é um corretor e não fornece aconselhamento em matéria de investimento, recomendações pessoais ou qualquer garantia de desempenho no futuro.


Preço
Desde 23/07/2025
6.91M
Volume negociado
27.63K
Pips ganhos
877
Instalações gratuitas