Deskripsi
▁▂▃▄▅▆▇ █ 10.000+ trader (institusional + ritel) █ ▇▆▅▄▃▂▁
- Pilih indikator TOP kami di cTrader 🏆
- ✨ Presisi eksklusif untuk hasil superior ✨
- 📈 Algoritma kami —dengan visual tertinggi 🎯—
- telah berhasil diterapkan di 2 dana kuantitatif
▁▂▃▄▅▆▇ █████████████████████████████ ▇▆▅▄▃▂▁
_______________________________________________
_______________________________________________
📌 Indikator Struktur Pasar
· ✅ AdvancedMarket Structure: Bos, Choch, SwinLevels, Order Blocks, Market Structure& Liquidity Finder
· 🔄 Dynamic Market StructureAnalysis of Turning Points
· 🧱 Order Block
· ⚖️ Market Imbalance
· ⛓️ BOS & CHOCH
· 🧠 ICT Power of 3
______________________________________________________________-
Store cBots : 🧠 Gold & BTC BreakoutSession Pivots 🧠
_______________________________________________
🔚 Sistem Keluar Pintar
_______________________________________________
📐 Indikator ZigZag
· 🔍 ZigZag Price LiquidityProjection
· ➖ ZigZag
_______________________________________________
🧱 Indikator Support & Resistance
· 🟩 SmartTrend Support &Resistance Lines
· 🧱 All Support and ResistanceLevels
_______________________________________________
📊 Indikator Tren & Saluran
· 📊 Supertrend
_______________________________________________
💧 Alat Volume & Likuiditas
_______________________________________________
⚡ Indikator Momentum & RSI
· 🔎 Multi-Level Candle BiasTracker
_______________________________________________
🔮 Alat Prediksi & Proyeksi
· 📐 Prediksi Berdasarkan Linreg& ATR
· 📏 Regresi Linear Fibonacci Multi-timeframe
· 📈 Proyektor Aliran Pasar Bertenaga Volume
______________________________________________________________________________________________________
MESIN PROBABILITAS PEMBALIKAN 🔄
Indikator hibrida untuk mendeteksi zona pembalikan + pemetaan multidimensi support dan resistance "Golden Levels." Ini menggabungkan analisis struktur (tinggi/rendah jendela Fibonacci), dinamika (kecepatan dan percepatan harga), entropi/chaos (urutan vs. kekacauan), momentum, dan volume untuk menghasilkan:
- Level support/resistance hierarkis berdasarkan horizon waktu.
- Sinyal probabilistik potensi pembalikan (puncak dan lembah) dengan kepercayaan %. ⚠️
- Zona aktif (persegi panjang) untuk mengontekstualisasikan perdagangan dan stop.
- Klaster konfluensi (ketika beberapa timeframe bertepatan pada harga yang sama). 🎯
2. Tujuan
Mengurangi kebisingan visual dan memudahkan pengambilan keputusan dengan mengidentifikasi:
- Di mana harga telah dikompresi atau berlabuh di berbagai horizon.
- Di mana probabilitas statistik pembalikan meningkat (terkonfirmasi atau diantisipasi). 📊
- Level mana yang memiliki "berat" terbesar (konfluensi).
3. Logika Konseptual
a) Level: Untuk setiap jendela Fibonacci, diambil tinggi (R) dan rendah (S) terbaru; ini memberikan skala fraktal konteks (ultra-pendek hingga makro).
b) Fusi: Jika beberapa level berbeda jatuh dalam X pips, mereka digabungkan → sebuah klaster dengan label gabungan dan hitungan konfluensi.
c) Sinyal Pembalikan: Dicari pola kelelahan lokal (bentuk gelombang), perlambatan (perubahan kemiringan), penurunan entropi rendah (entropi rendah = gerakan lebih terarah yang cenderung berbalik), kemungkinan divergensi internal, dan validasi momentum/volume.
d) Mode Prediktif: Memungkinkan mengantisipasi pembalikan (berlian) sebelum konfirmasi penuh jika percepatan berlawanan + entropi rendah + keadaan ekstrem sejajar. 💎
e) Probabilitas: Pembobotan ternormalisasi dari berbagai faktor (tren, chaos, momentum, volume, divergensi, adaptasi). Hasil dipotong 40–99%.
f) Zona Aktif: Setelah sinyal, rentang paling logis (antara level relevan) dicari untuk mengelola perdagangan dan mengontekstualisasikan stop.
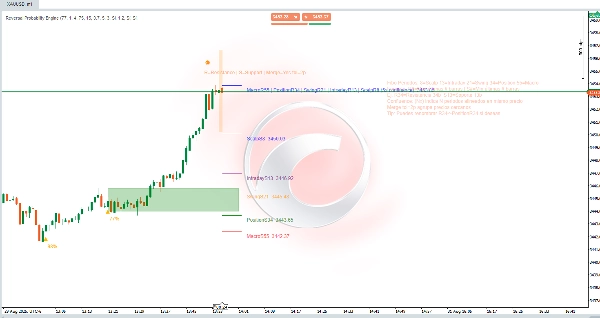
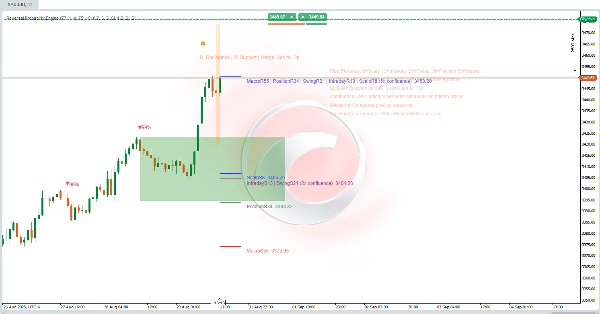
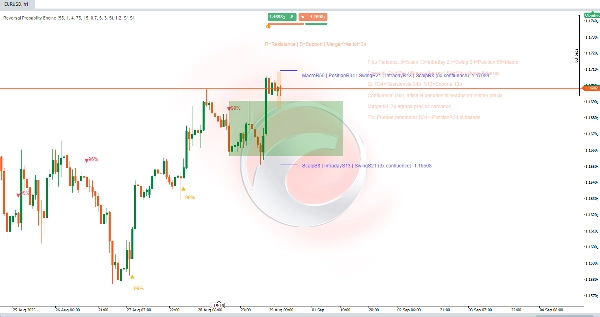
4. Komponen Visual
- Garis horizontal: Level berdasarkan periode (Scalp 8, Intraday 13, Swing 21, Position 34, Macro 55). Warna konsisten per horizon.
- Label R#/S#: R = Resistance (tinggi terbaru jendela itu), S = Support (rendah terbaru). Contoh: R34 = resistance yang berasal dari 34 candle terakhir.
- Label Gabungan:
ScalpS8 | IntradayS13 | … (5x konfluensi) Harga. Menunjukkan bahwa N periode berbeda menghasilkan level yang sama (atau dalam toleransi). Semakin banyak, semakin relevan. ✅ - (Nx konfluensi): Jumlah periode yang bertepatan.
- Merge tol=Xp: Toleransi dalam pips yang mengelompokkan level yang berdekatan (menghindari saturasi).
- Probabilitas (%): Teks di atas/bawah segitiga (Turun / Naik) atau berlian (deteksi dini).
- Persegi hijau (zona aktif): Saluran operasional dinamis di mana evolusi pasca-sinyal dievaluasi.
- Blok/warna tambahan halus: Elemen pendukung (gelombang/partikel) jika diaktifkan.
5. Interpretasi Praktis
- Konfluensi tinggi (≥3x) = "magnet" atau level pivot yang kuat; perhatikan reaksi harga. 🧲
- Sinyal + konfluensi dekat memperkuat validitas (tetapi tidak menjamin).
- Probabilitas ≥ Min Confidence %: Filter minimum untuk mempertimbangkan aksi.
- Bedakan Antisipasi (berlian) vs. Terkonfirmasi (segitiga): Antisipasi menawarkan risiko/imbalan lebih baik, tingkat false lebih tinggi; yang terkonfirmasi datang dengan asimetri lebih sedikit tetapi validasi lebih banyak.
- Persegi panjang: Jika harga tetap di dalam dan tidak membatalkan tepi berlawanan, tesis tetap hidup; pelarian bersih mengurangi ekspektasi.
- Perbesar atau perkecil MergeTolerance: Lebih kecil = granularitas lebih besar, Lebih besar = klaster lebih sintetis.
6. Alur Penggunaan
- Muat indikator pada instrumen dan timeframe yang diinginkan.
- Sesuaikan Min Confidence % sesuai toleransi (misal, lebih rendah untuk scalping, lebih tinggi untuk swing).
- Periksa apakah muncul klaster support/resistance ganda (5x, 4x, dll.).
- Tunggu sinyal (ideal jika muncul di pinggiran klaster dan dengan probabilitas tinggi). 🔔
- Batasi manajemen dalam zona aktif: masuk bertahap atau konfirmasi breakout gagal.
- Tentukan stop logis: di luar level bawah pertama (untuk long) atau atas (untuk short) yang tidak ada dalam konfluensi.
- Nonaktifkan periode yang tidak digunakan (misal, hanya Swing/Macro untuk posisi long).
- Sesuaikan toleransi dan, opsional, sembunyikan panel penjelasan setelah dipelajari.
7. Contoh Membaca Label Cepat
ScalpS8 | IntradayS13 | SwingS21 | PositionS34 | MacroS55 (5x konfluensi)
Arti: Semua timeframe (8–55) berbagi dasar yang sama → support struktural multi-skala. Probabilitas reaksi lebih tinggi; jika hilang dengan volume, ini menunjukkan perubahan rezim yang lebih serius. 🚨
Ringkasan
Key features include:
- Hierarchical support and resistance levels categorized by time horizons (from ultra-short scalp to macro scales).
- Probabilistic reversal signals indicating potential peaks and valleys with confidence percentages.
- Active zones displayed as rectangles to help contextualize trade entries and stop placements.
- Confluence clusters that highlight price levels confirmed across multiple timeframes, enhancing level significance.
The indicator reduces visual noise by grouping nearby levels within a tolerance range and provides clear visual components such as horizontal lines, labeled resistance/support points, merged confluence labels, probability percentages, and active zones. It distinguishes between anticipated and confirmed reversal signals, offering traders options for risk management and trade timing.
Users can adjust confidence thresholds and merge tolerances to tailor granularity and filtering according to their trading style and timeframe. The tool supports structured decision-making by identifying statistically significant reversal areas and multi-scale support/resistance clusters on any instrument and timeframe.
Ulasan pelanggan
5 | 0 % | |
4 | 0 % | |
3 | 0 % | |
2 | 0 % | |
1 | 100 % |