
الوصف
استمرار موجة إليوت-3 وارتدادات إليوت
هيكل موجة إليوت هو مؤشر مصمم لتحليل هيكل السوق باستخدام نظرية موجة إليوت.
يجمع بين تحليل التأرجح المؤكد، هيكل السوق، كشف دافع إليوت، و استمرار موجة-2 إلى موجة-3 مخصص.
تم بناء هذه الأداة للمتداولين الذين يحتاجون إلى وضوح، تأكيد، وتنفيذ قائم على قواعد، وليس رسمًا ذاتيًا.
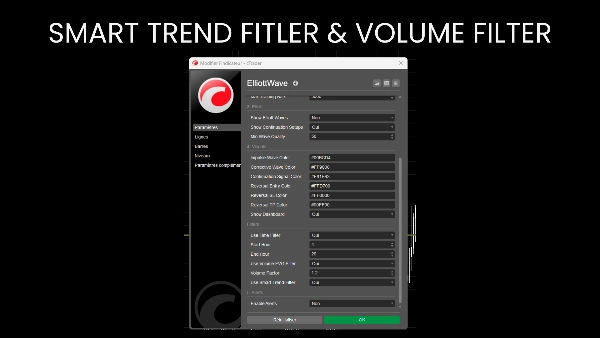
محرك التأرجح غير المعاد رسمه
جميع الحسابات تعتمد على نقاط التأرجح المؤكدة باستخدام:
- عمق التأرجح القابل للتعديل
- انحراف السعر الأدنى (مرشح النقاط)
- أشرطة التأكيد
بمجرد طباعة التأرجح، لا يتحرك أبدًا، مما يضمن موثوقية تاريخية كاملة.
تحليل هيكل السوق:
يحدد ويصنف تلقائيًا:
- أعلى قمة (HH)
- أدنى قاع أعلى (HL)
- قمة أدنى (LH)
- قاع أدنى (LL)
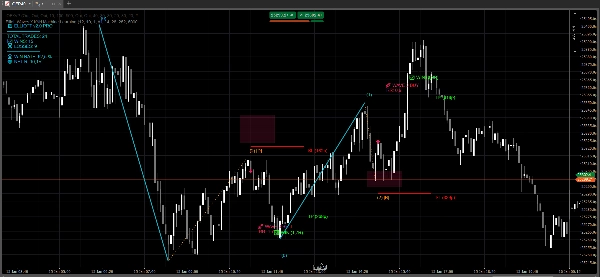
كشف دافع موجة إليوت:
يكتشف المؤشر تلقائيًا دوافع موجة إليوت الكاملة ذات الخمس موجات في كلا الاتجاهين:
- صعودي: L-H-L-H-L-H
- هبوطي: H-L-H-L-H-L
يُحقق في الدوافع باستخدام قواعد داخلية:
- قوة الموجة 3
- منطق تصحيح الموجة 2 والموجة 4
- تناسب الموجة 5
يتم تقييم كل دافع باستخدام درجة جودة (0–100) ويتم وسمه مباشرة على الرسم البياني.
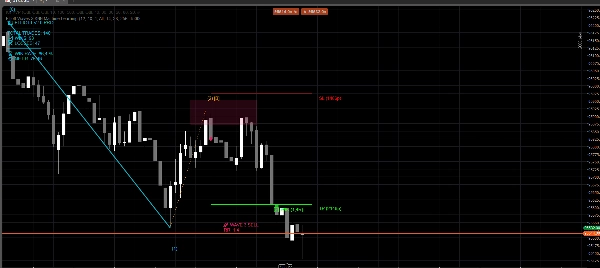
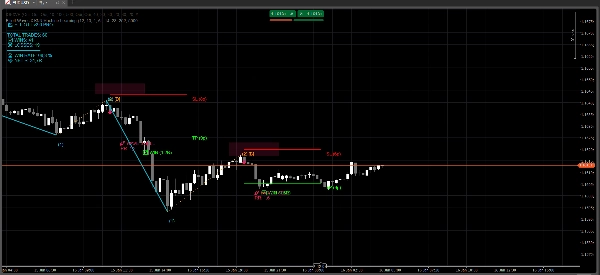
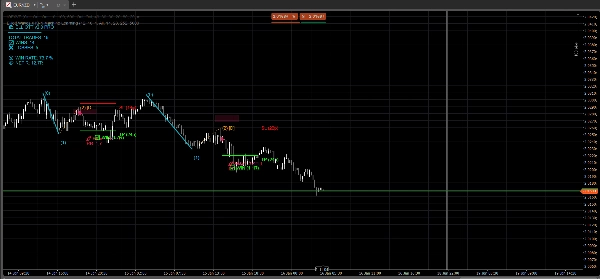
إعداد استمرار موجة-3 (الوحدة الأساسية للتداول)
هذا هو المكون الأساسي للتداول في المؤشر.
يحدد النظام هياكل استمرار موجة 0-1-2 ويجهز نقاط الدخول للموجة 3:
- صعودي: منخفض → مرتفع → منخفض أعلى
- هبوطي: مرتفع → منخفض → مرتفع أدنى
معايير التحقق تشمل:
- تصحيح الموجة 2 بين 23.6% و 88.6%
- عدم الإبطال عبر الموجة 0
- محاذاة الاتجاه باستخدام هيكل السوق
- قوة الموجة 1 نسبة إلى ATR
- يجب أن يكون السعر جالسًا على OB
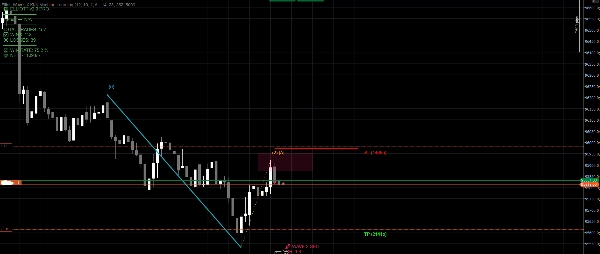
عند التحقق، يرسم المؤشر تلقائيًا:
- هيكل الموجة 1 والموجة 2
- منطقة دخول OB
- إشارة الدخول
- وقف الخسارة بناءً على ATR خارج الموجة 2
- جني الأرباح بناءً على توقع ATR
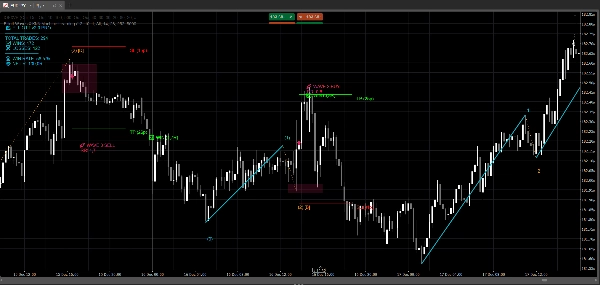
إدارة المخاطر والتداول
- يتم حساب وقف الخسارة وجني الأرباح ديناميكيًا باستخدام ATR
- يتم عرض نسبة المخاطرة إلى العائد مباشرة على الرسم البياني
- مصمم لتجنب الإعدادات المفرطة أو منخفضة الجودة
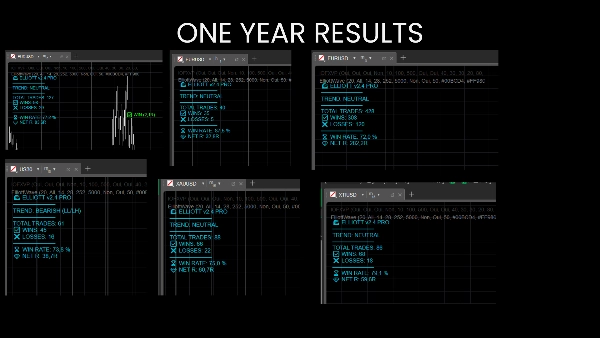
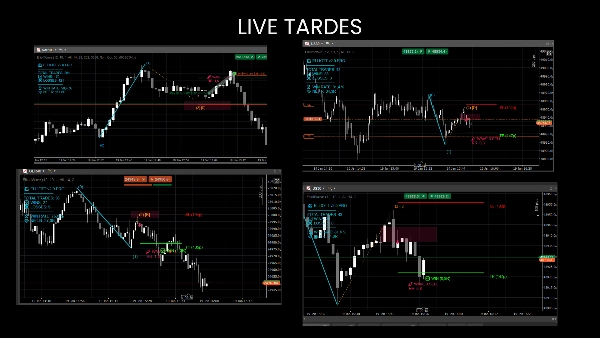
أنا شخصيًا أستخدمه للتداول السريع على المؤشرات في M1 و M5، لكنه يعمل أيضًا مع الفوركس، السلع، الأسهم، إلخ... تعرض لوحة التحكم ما إذا كان قد كان مربحًا على أصل معين.
تتيح النسخة المجانية لك التجربة على الفوركس الرئيسي M15.


![شعار "[Stellar Strategies] Ultimate Trend & Momentum Dashboard"](https://cdn.ctrader.com/image/webp/e9a9c9e9-4b6c-4bc0-9988-4c4768a23b6c_30290)


