Insider_CumulativeDelta
مؤشر
820 التنزيلات
الإصدار 1.0، Apr 2025
Windows, Mac
5.0
التقييمات: 1
الوصف
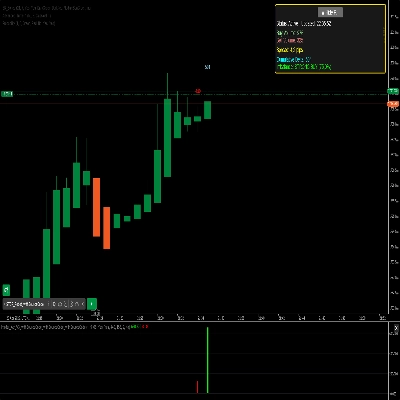
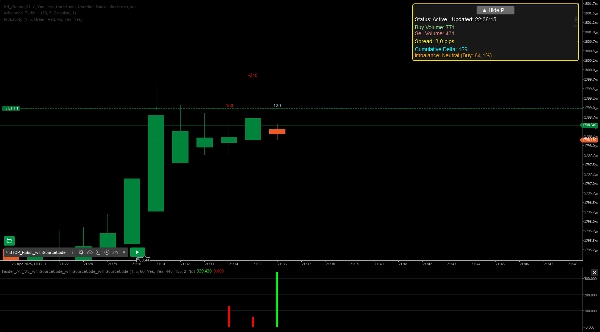
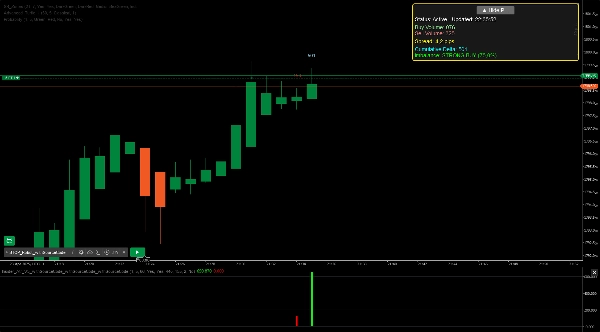
مؤشر دلتا التراكمي وعدم التوازن القوي.
Insider هو مؤشر قوي لمنصة cTrader مصمم لتحليل بيانات عمق السوق وتسليط الضوء على عدم التوازن بين الشراء والبيع في الوقت الحقيقي. يوفر ردود فعل بصرية واضحة على الرسم البياني، ويعرض مقاييس رئيسية مثل حجم الشراء/البيع، والدلتا التراكمية، وقوة عدم التوازن من خلال الرسوم البيانية المدرجة ولوحة تحكم قابلة للتخصيص. قم بتخصيصه وفقًا لأسلوب تداولك مع إعدادات قابلة للتعديل، بما في ذلك فترة العرض، ومستويات العمق (1-10)، وعامل عدم توازن الحجم (50-95%). تشمل الميزات الإضافية تنبيهات اختيارية لعدم التوازن القوي، وتصفية ساعات التداول، ولوحة قابلة لتغيير الحجم لتحسين سهولة الاستخدام. مثالي للمتداولين اليوميين ومتداولي التأرجح، يقدم هذا المؤشر رؤى قيمة حول معنويات السوق والتحركات المحتملة للأسعار.
الملخص
ملخص الذكاء الاصطناعي
Insider_CumulativeDelta is a cTrader indicator that analyzes market depth data to identify buy and sell imbalances in real time. It visually presents key metrics such as buy/sell volume, cumulative delta, and imbalance strength using histograms and a customizable dashboard directly on the trading chart. Users can adjust settings including display period, depth levels (1 to 10), and volume imbalance thresholds (50% to 95%) to suit their trading preferences. Additional features include optional alerts for significant imbalances, filtering by trading hours, and a resizable panel for improved usability. This indicator is designed to support day traders and swing traders by providing insights into market sentiment and potential price movements.
ملف تعريف المؤشر
تقييمات العملاء
5.0
التقييمات: 1
5 | 100 % | |
4 | 0 % | |
3 | 0 % | |
2 | 0 % | |
1 | 0 % |
تقييمات العملاء
August 12, 2025
Pros: Accurate order flow insight, customizable display, valuable for intraday trading. Cons: No alerts, requires experience to interpret, no MTF mode.
مناقشة
الأسئلة الشائعة
يتم توفير المنتجات المتاحة من خلال cTrader Store، بما في ذلك روبوتات التداول والمؤشرات والإضافات، من قبل مطوري الطرف الثالث وإتاحتها لأغراض الوصول المعلوماتي والفني فقط. cTrader Store ليس وسيطًا ولا يقدم نصائح استثمارية أو توصيات شخصية أو أي ضمان للأداء المستقبلي.


![شعار "High-Low Divergence [Iridio Capital]"](https://cdn.ctrader.com/image/webp/443c4661-7abb-40f1-842f-4b6ec560649b_40914)
السعر
منذ 09/01/2025
11.78K
التثبيتات المجانية