Opis
🌟 Regresja Liniowa Fibonacciego🌟
Wskaźnik Fibonacci Regression Bands to zaawansowane narzędzie techniczne, które łączy moc linii regresji z poziomami Fibonacciego, aby identyfikować trendy, strefy wsparcia/oporu oraz potencjalne punkty odwrócenia na rynkach finansowych. 📈 Ten wskaźnik oferuje wielowymiarową perspektywę poprzez analizę wielu ram czasowych jednocześnie (5m, 15m, 30m i 4h), co pozwala traderom precyzyjniej określać obszary konfluencji. ⏳
🎯 Co robi wskaźnik?
Wskaźnik tworzy kanały regresji oparte na historycznych danych cenowych i integruje je z poziomami zniesienia Fibonacciego, dostarczając kompleksową wizualną mapę kluczowych stref rynkowych. Analizując różne ramy czasowe, oferuje całościowy obraz zachowania cen, łącząc długoterminowe trendy z krótkoterminową akcją cenową. 📊
🔍 Główne składniki
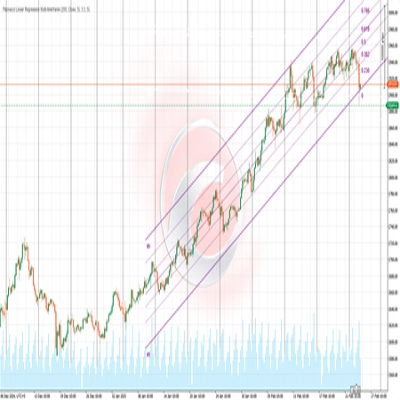
- Kanały regresji: Wskaźnik oblicza linie regresji liniowej na zadanym przez użytkownika okresie (domyślnie: 200 świec), aby pokazać ogólny trend cenowy. 📉📈
- Pasma odchylenia: Górne i dolne pasma rysowane wokół centralnej linii regresji, reprezentujące odchylenia statystyczne od ceny, podobne do wstęg Bollingera, ale oparte na regresji liniowej. 📐
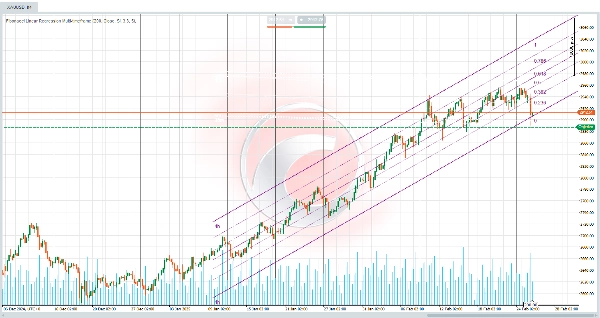
- Poziomy Fibonacciego: Klasyczne poziomy Fibonacciego (0, 0.236, 0.382, 0.5, 0.618, 0.786 i 1) są nanoszone w kanale, oferując potencjalne punkty odbicia lub kontynuacji. 🔢
- Analiza wieloramowa: Jednoczesna analiza ram czasowych 5-minutowych, 15-minutowych, 30-minutowych i 4-godzinnych, z każdą reprezentowaną innym kolorem, pomaga zidentyfikować strefy, gdzie wiele ram czasowych się pokrywa. 🎨
🔄 Wielowymiarowa analiza rynku
Ta strategia pozwala spojrzeć na rynek z wielu perspektyw, integrując długoterminowe trendy z krótkoterminowymi ruchami cen. Podejście to umożliwia:
- Dynamiczne dostosowywanie transakcji w miarę rozwoju rynku. 🔄
- Przełączanie się między ramami czasowymi w razie potrzeby. ⏱️
- Chwytanie dużych ruchów w ramach głównego trendu. 🚀
- Wykorzystywanie mniejszych wahań do optymalizacji punktów wejścia i wyjścia. 🎯
🔄 Interakcja między ramami czasowymi
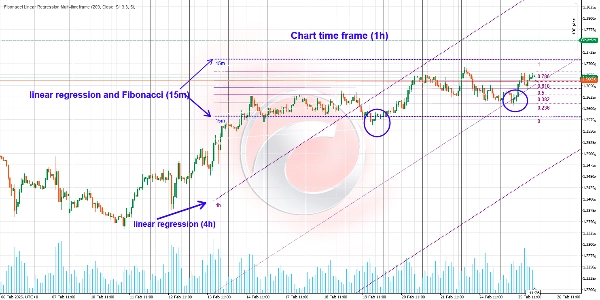
4-godzinna rama czasowa z kanałem regresji
- Daje wgląd w dominujący trend. 💪
- Stanowi solidną podstawę do oceny ogólnego kierunku rynku.
- W tym kontekście poziomy Fibonacciego mogą być wyłączone, aby uniknąć zagracenia wykresu.
- Skupienie pozostaje na kanale regresji pokazującym przeważający trend.
Niższe ramy czasowe z regresją i Fibonaccim
- Aktywuj linie regresji i poziomy Fibonacciego na krótszych ramach czasowych (5m, 15m lub 30m).
- Uzyskaj precyzyjniejsze sygnały w kontekście szerszego trendu.
- Poziomy Fibonacciego pomagają zidentyfikować potencjalne punkty wejścia i wyjścia w ramach większej ramy czasowej.
📊 Jak interpretować wyniki
Identyfikacja trendów
- Kierunek centralnej linii regresji wskazuje dominujący trend (wzrostowy, spadkowy lub boczny). 📈📉➡️
- Nachylenie linii sugeruje siłę trendu — strome nachylenia wskazują na silniejsze trendy. 🔍
- Zbieżność linii regresji z różnych ram czasowych w tym samym kierunku oznacza silny i wiarygodny trend.
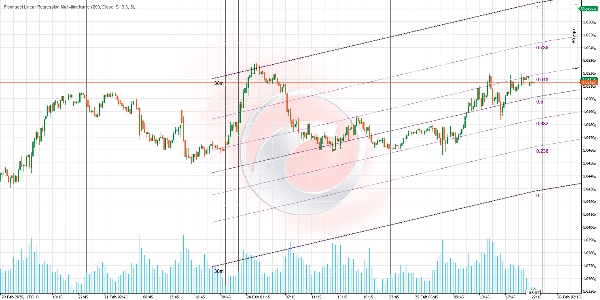
Strefy wsparcia i oporu
- Górne i dolne pasma działają jako dynamiczne strefy wsparcia i oporu. 🛡️
- Poziomy Fibonacciego w kanale dostarczają dodatkowego wsparcia/oporu, zwłaszcza na poziomach 0.618 i 0.382.
- Gdy poziomy Fibonacciego z różnych ram czasowych się pokrywają, tworzą strefy konfluencji o wysokim prawdopodobieństwie.
🌐 Identyfikacja stref konfluencji
Strefy konfluencji występują tam, gdzie linie regresji i poziomy Fibonacciego się pokrywają. Obszary te reprezentują prawdopodobne punkty znaczącej reakcji cenowej:
- Gdy zniesienie Fibonacciego pokrywa się z górną lub dolną krawędzią kanału regresji, działa jako silny punkt wsparcia lub oporu.
- Gdy linie regresji z różnych ram czasowych przecinają się lub zbliżają.
- Gdy poziomy Fibonacciego z wielu ram czasowych pokrywają się w określonym obszarze.
- Gdy cena odbija się dokładnie na poziomie Fibonacciego, który pokrywa się z linią kanału regresji.
🔄 Identyfikacja stref odwrócenia
Jeśli cena przebije kanał regresji na niższej ramie czasowej i zbliży się do kluczowego poziomu Fibonacciego, może to sygnalizować możliwe odwrócenie. Dodatkowe oznaki odwrócenia to:
- Przeciążenie: Gdy cena osiąga lub przekracza górne/dolne pasmo, zwłaszcza gdy jest to zgodne z poziomami Fibonacciego z wielu ram czasowych.
- Divergencja z wskaźnikami momentum: Używanie tego wskaźnika wraz z RSI, MACD lub innymi może zwiększyć wykrywanie dywergencji.
- Przebicie linii centralnej: Przekroczenie centralnej linii regresji może sygnalizować zmianę dynamiki cen, szczególnie jeśli dzieje się to jednocześnie na wielu ramach czasowych.
🧩 Wielość scenariuszy
Wykorzystanie różnych kombinacji kanałów regresji i poziomów Fibonacciego na wielu ramach czasowych może tworzyć różnorodne scenariusze handlowe:
- Utrzymuj pozycję długą na 4-godzinnej ramie czasowej, jednocześnie handlując na mniejszych ramach, aby wykorzystać odbicia od poziomów Fibonacciego.
- Identyfikuj główny trend za pomocą kanału regresji 4-godzinnej i znajdź optymalne wejścia podczas cofnięć do poziomów Fibonacciego na mniejszych ramach.
- Wykorzystuj konfluencje na wielu ramach czasowych, aby potwierdzić punkty wejścia i wyjścia o wysokim prawdopodobieństwie.
📈 Strategie handlowe
Strategia odwrócenia
- Identyfikuj strefy, gdzie konwergują się poziomy Fibonacciego i pasma z różnych ram czasowych.
- Czekaj na potwierdzenie ceny (formacje świecowe, dywergencje itp.).
- Wejdź przeciwko poprzedniemu trendowi z ciasnym stop lossem.
- Ustaw cele na następnym poziomie Fibonacciego lub centralnej linii regresji.
Strategia kontynuacji
- Szukaj cofnięć do linii centralnej lub kluczowych poziomów Fibonacciego (0.382 lub 0.618).
- Potwierdź, że ogólny trend pozostaje nienaruszony na wielu ramach czasowych.
- Wejdź w kierunku trendu, gdy cena odbija się od tych poziomów.
- Ustaw stop lossy poniżej/powyżej odpowiedniego poziomu Fibonacciego.
Korzystając ze wskaźnika Fibonacci Linear Regression, traderzy mogą uzyskać głębszy wgląd w dynamikę rynku i podejmować bardziej świadome decyzje handlowe. Bądź czujny i handluj mądrze! 💻📈
Wskaźniki ze sklepu Ctrader:
Dynamic Market Structure
Analysis of Turning Points
Fibonacci Linear
Regression Multi-timeframe
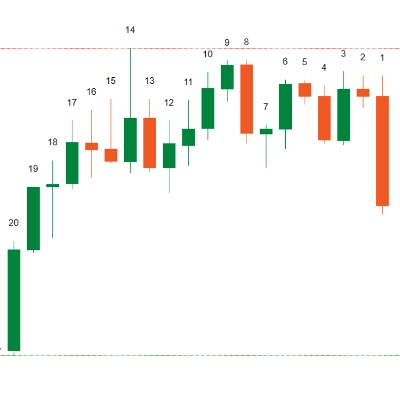
Multi-Level Candle Bias
Tracker
Auto Support and
Resistance Trend Lines
Podsumowanie
This indicator performs simultaneous analysis across multiple timeframes—5-minute, 15-minute, 30-minute, and 4-hour—each displayed in distinct colors to identify confluence zones where signals from different timeframes align. The 4-hour timeframe focuses on the dominant trend using regression channels, while shorter timeframes include Fibonacci levels for precise entry and exit signals.
Traders can interpret the slope and direction of regression lines to assess trend strength and direction. Upper and lower bands act as dynamic support and resistance, with Fibonacci levels providing additional key zones. Confluence of regression lines and Fibonacci levels across timeframes highlights high-probability reaction points. The indicator supports reversal and continuation strategies by identifying key zones and confirming price action with multi-timeframe context.
Opinie klientów
5 | 100 % | |
4 | 0 % | |
3 | 0 % | |
2 | 0 % | |
1 | 0 % |