
说明
cTrader高级唐奇安区间指标
精准掌握市场趋势与突破!
通过高级唐奇安区间指标,将您的交易提升到新高度——这是一款为追求准确性、灵活性和高效性的交易者设计的强大工具。该下一代指标通过引入多时间框架分析、可定制价格计算、实时提醒和云图可视化,增强了经典唐奇安通道的功能。
无论您交易外汇、股票还是商品,高级唐奇安区间指标都能为您提供识别突破、顺势交易和反转交易的工具,助您如专业人士般操作。
主要功能与优势:
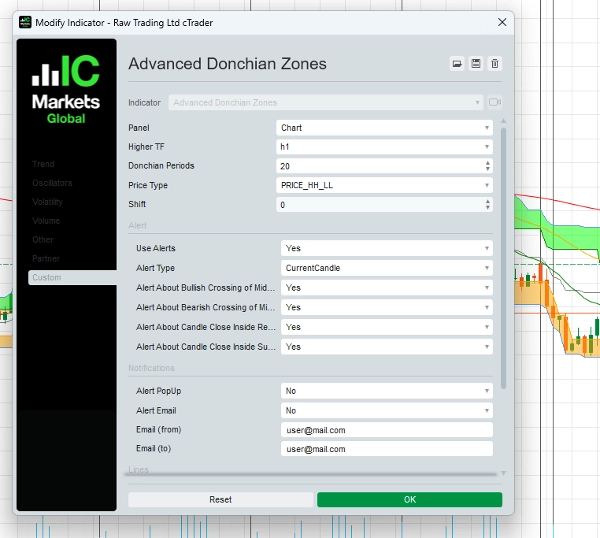
1. 多时间框架唐奇安区间
- 在较低时间框架交易时,分析更高时间框架的唐奇安区间,确保您始终与更大的市场趋势保持一致。
- 非常适合日内交易者和波段交易者优化进出场时机。
2. 可定制价格计算
- 从五种高级价格类型中选择,以优化您的策略:
-
- 最高价/最低价
- 最高价/开盘价或最高价/收盘价平均值
- 最高开盘价/最低开盘价
- 最高收盘价/最低收盘价
- 根据您的交易风格和风险管理调整指标。
3. 动态提醒——绝不错过任何机会!
- 当关键交易事件发生时,获取实时通知:
-
- 中线交叉(看涨或看跌信号)
- 价格收盘于关键区间内(潜在反转或突破区)
- 通过弹窗和电子邮件接收提醒,助您领先市场动态。
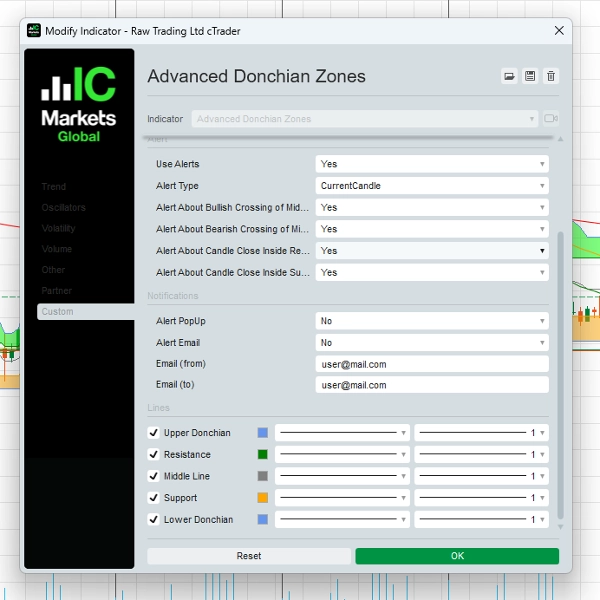
4. 云图可视化,洞察清晰
- 独特的阴影区间位于唐奇安水平之间,帮助交易者快速且有效地视觉识别支撑、阻力和突破区域。
5. 灵活的偏移参数
- 调整唐奇安区间在时间上的前移或后移,以微调您的交易策略。
6. 易用界面
- 为各级交易者设计,布局直观,设置可定制,满足您的交易偏好。
如何使用高级唐奇安区间指标
1. 突破交易策略——捕捉爆发性行情!
- 设置:
-
- 将高级唐奇安区间指标应用于您的图表。
- 选择一个唐奇安周期(例如20)和一个更高时间框架(例如1小时或4小时),以获得更准确的信号。
- 入场:
-
- 做多当价格突破并收盘于上方唐奇安区间时。
- 做空当价格突破并收盘于下方唐奇安区间时。
- 出场:
-
- 使用中线或相反的唐奇安区间作为您的出场点。
- 示例:
-
- 如果交易15分钟图表,则基于1小时时间框架设置唐奇安计算。当价格突破上方唐奇安水平时,开多单,止损设在中线附近。
2. 跟随趋势策略——顺势而为
- 设置:
-
- 使用中线作为趋势过滤器。
- 仅在主导趋势方向交易。
- 入场:
-
- 做多当价格位于中线上方且从支撑区反弹时。
- 做空当价格位于中线下方且从阻力区反弹时。
- 出场:
-
- 当价格反向穿越中线时平仓。
- 示例:
-
- 在4小时图表上,价格保持中线上方,确认上升趋势。当价格回调至支撑区并显示反转信号时,开多单。
3. 区间交易策略——在震荡市场中获利
- 设置:
-
- 识别价格在上方和下方唐奇安区间之间波动的时期。
- 入场:
-
- 做多当价格接近支撑位时。
- 做空当价格接近阻力位时。
- 出场:
-
- 在相反的唐奇安区间附近获利,或当发生突破时平仓。
- 示例:
-
- 在1小时图表上,如果价格在上方和下方唐奇安水平之间波动,则在这些极端位置执行交易,寻找均值回归机会。
为什么交易者选择高级唐奇安区间
✔ 适用于多种交易风格——适合突破、跟随趋势和区间交易。
✔ 提升交易精准度——准确识别关键支撑和阻力位。
✔ 实时提醒——即时通知,保持信息领先。
✔ 专业级工具——为寻求市场优势的交易者开发。
价格与独家优惠
限时特价: $97(一次性付款)
包含内容:
- cTrader高级唐奇安区间指标
- 全面用户指南,包含逐步策略
- 1年免费更新
- 优先电子邮件支持
交易者评价
“我使用唐奇安通道多年,但这个指标提升到了另一个层次。多时间框架功能真是改变游戏规则!”
— Mark S., 外汇交易员
“提醒和可定制价格设置帮助我更自信地捕捉突破交易。强烈推荐给认真交易者。”
— Lisa T., 波段交易员
立即开始!
准备好改变您的交易了吗?点击下方按钮购买高级唐奇安区间指标,开始精准交易!
[立即购买,价格$97]
30天退款保证
我们对产品充满信心。如果您不完全满意,请在30天内联系我们,享受全额退款——无任何疑问。
需要帮助?联系我们!
📧 邮箱: o.elmottaqy@gmail.com
🌐 网站: https://t.me/mottaqyo
风险声明
交易存在风险。高级唐奇安区间指标是辅助您做出交易决策的工具,但不保证盈利。请始终使用适当的风险管理并负责任地交易。
摘要
Key functionalities include real-time alerts via pop-ups and email for significant events such as midline crossovers and price closing inside key zones, helping traders stay informed of potential breakouts or reversals. A unique cloud visualization feature shades zones between Donchian levels to clearly identify support, resistance, and breakout areas. The flexible shift parameter allows users to adjust the positioning of Donchian Zones forward or backward in time for strategy fine-tuning.
Suitable for forex, stocks, and commodities markets, this indicator supports multiple trading strategies including breakout, trend-following, and range-bound trading. It features an intuitive interface designed for traders of all levels. The product includes a comprehensive user guide with step-by-step strategies, free updates for one year, and priority email support.
客户评价
5 | 50 % | |
4 | 50 % | |
3 | 0 % | |
2 | 0 % | |
1 | 0 % |


