
Описание
Индикатор MAGIC BLOCK STRATEGY сочетает два основных подхода к анализу рынка:
Обнаружение ордерных блоков:
Определяет зоны поддержки и сопротивления на основе неперекрытых максимумов и минимумов за период обзора.
Генерирует сигналы на покупку, когда цена закрывается выше неперекрытого минимума.
Генерирует сигналы на продажу, когда цена закрывается ниже неперекрытого максимума.
Анализ ликвидности:
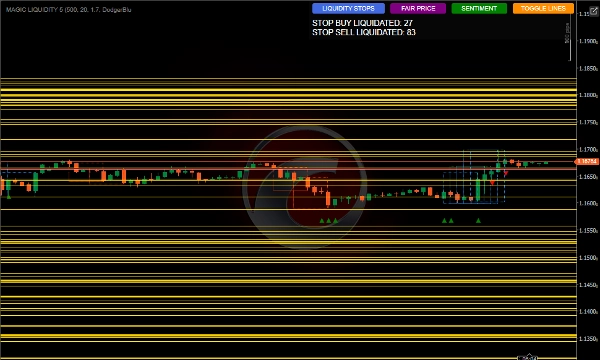
Обнаруживает зоны скопления ликвидности, где могут сосредотачиваться стоп-лоссы.
Отслеживает активацию стопов на покупку и продажу.
Вычисляет рыночный сентимент на основе распределения ликвидности.
Определяет наиболее торгуемую справедливую цену.
Как использовать для достижения лучших результатов
Начальная настройка
Период обзора: Настройте параметр Период обзора в соответствии с таймфреймом, на котором вы торгуете — более высокие значения для более высоких таймфреймов.
Количество свечей для анализа: Оставьте 500 для надежного анализа или уменьшите для более быстрой реакции.
Цвет зоны ликвидности: Выберите цвет, который выделяется на вашем графике.
Интерпретация сигналов
Сигналы ордерных блоков:
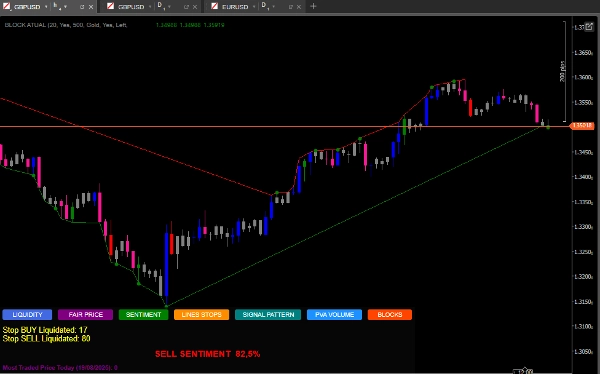
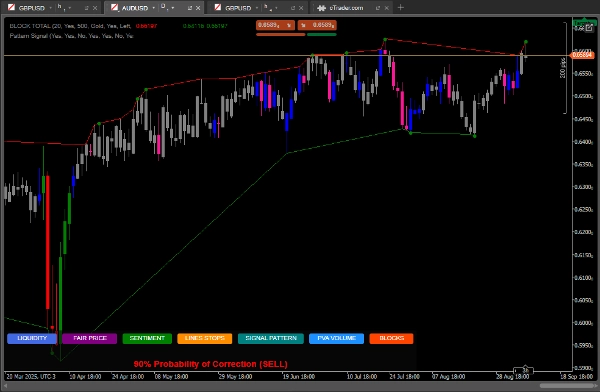
Зеленые точки: сигналы на покупку, когда цена закрывается выше неперекрытого минимума.
Красные точки: сигналы на продажу, когда цена закрывается ниже неперекрытого максимума.
Зоны ликвидности:
Горизонтальные линии показывают зоны ликвидности — потенциальные цели или точки разворота.
Отслеживайте соотношение ликвидности выше/ниже текущей цены.
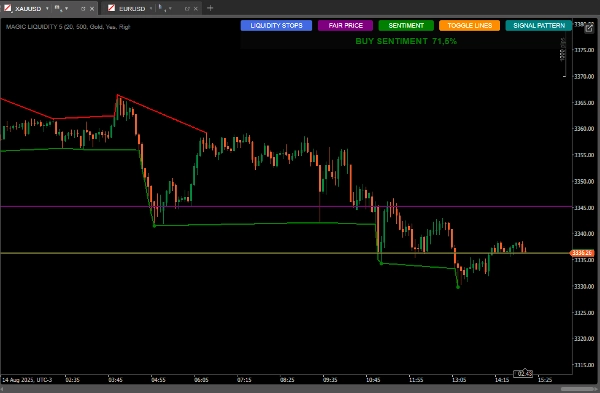
Рыночный сентимент:
Используйте кнопку SENTIMENT, чтобы увидеть преобладающее направление и уверенность.
Покупательский сентимент с высокой уверенностью указывает на продолжение роста. Сентимент на продажу с высокой уверенностью указывает на продолжение медвежьего тренда.
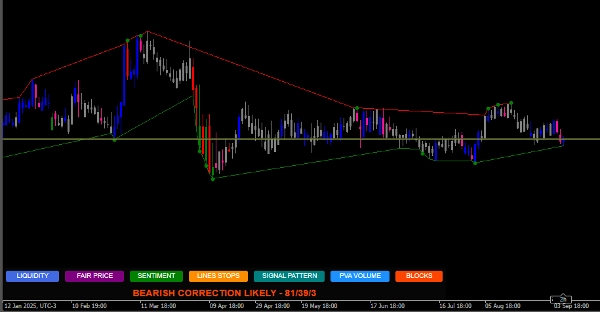
Свечные паттерны:
Кнопка SIGNAL PATTERN анализирует и
Показывает вероятности коррекции на основе количественного соотношения
Наиболее торгуемая справедливая цена:
Кнопка PRICE показывает уровень цены с наибольшим объемом за день.
Она может выступать как магнит для цены или как поддержка/сопротивление.
Стратегии использования
Консервативная стратегия:
Торгуйте только когда сигналы ордерных блоков совпадают с преобладающим сентиментом.
Используйте зоны ликвидности как цели для фиксации прибыли.
Агрессивная стратегия:
Ожидайте разворотов, когда цена приближается к зонам ликвидности с большим количеством накопленных стопов.
Используйте дивергенции между сентиментом и ценовым движением для контртрендовых сделок.
Дополнительное подтверждение:
Сравните с свечным паттерном, отображаемым индикатором.
Проверьте, находится ли справедливая цена поблизости как зона интереса.
Управление рисками.
Стоп-лосс:
Размещайте ниже последнего ордерного блока для покупок
Размещайте выше последнего ордерного блока для продаж
Тейк-профит:
Цели в ближайших зонах ликвидности
Учитывайте соотношение ликвидности выше/ниже для установки целей
Продвинутые советы
Используйте кнопку TOGGLE LINES, чтобы отключить линии ликвидности, когда график становится загроможденным
Отслеживайте количество ликвидированных стопов для оценки силы движения
Справедливая цена особенно полезна на рынках с ограниченным диапазоном, выступая как динамическая поддержка/сопротивление
Комбинируйте с другими индикаторами для подтверждения — объем, скользящие средние
SIGNAL PATTERN ДОСТУПЕН НА ТАЙМФРЕЙМЕ D1.
https://ctrader.com/pt/products/1725?u=Goulart
https://ctrader.com/pt/products/1386?u=Goulart
Сводка
The indicator also analyzes liquidity pools, highlighting areas where stop losses may accumulate and monitoring the activation of buy and sell stops. It calculates market sentiment based on liquidity distribution and identifies the most traded price level of the day, which can act as dynamic support or resistance.
Users can customize parameters such as lookback period and number of candles for analysis to suit different timeframes and trading styles. Visual signals include green and red dots for buy and sell order block signals, horizontal lines for liquidity pools, and sentiment indicators showing prevailing market direction and confidence.
The tool supports conservative strategies that align order block signals with sentiment and use liquidity pools as profit targets, as well as aggressive strategies that anticipate reversals near liquidity pools and exploit divergences between sentiment and price action. Additional features include candlestick pattern correction probabilities and options to toggle liquidity lines for chart clarity. Risk management guidance suggests placing stop-loss orders relative to recent order blocks and setting take-profit targets near liquidity pools.


![Логотип продукта "[Stellar Strategies] Smart ADX"](https://cdn.ctrader.com/image/webp/af13b084-b6f6-41db-b7bc-c7e688b57b05_36929)


