
Описание
🔷 Trend Lines Premium Engine
Многоуровневая структура рынка и индикатор динамической регрессии
https://chartshots.spotware.com/c/69d3c949a2e08
📌 Что это?
Trend Lines Premium Engine — это индикатор-оверлей, который объединяет 5 независимых модулей в один инструмент. Каждый модуль можно включать или отключать. Он отображает структуру рынка, динамические каналы и зоны регрессии на основе объема непосредственно на графике цены.
Он отвечает на три основных вопроса:
- Где находится цена в текущей структуре?
- Каков доминирующий тренд и где точки пробоя?
- На каких ценовых уровнях сосредоточена активность?
🧩 5 модулей
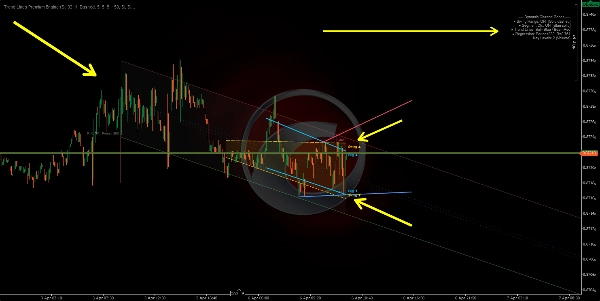
1️⃣ Swing Range Connector
https://chartshots.spotware.com/c/69d3cab9b805b
Обнаруживает самые последние экстремумы (максимумы и минимумы), затем рисует наклонный канал соединяя самый старый и самый новый экстремумы с обеих сторон. Область между ними заполняется как динамическая зона диапазона.
Как это работает:
- Бар считается экстремумом, если его максимум (или минимум) является самым крайним по сравнению с N барами до и N барами после него.
- Прямая линия проводится от самого старого экстремума к самому новому, создавая верхнюю и нижнюю границы.
- Канал автоматически смещается каждый раз, когда подтверждается новый экстремум.
Как читать:
- Цена внутри канала → определённый структурный диапазон.
- Прорыв вверх/вниз → расширение волатильности или сдвиг структуры.
- Наклон канала → преобладающее направление диапазона.
Параметр
Назначение
Bars Before / After Swing
Количество баров с каждой стороны для подтверждения экстремума. Чем больше — тем значительнее экстремумы
Max Swing Points
Сколько экстремумов хранить. Контролирует глубину канала
History Window
Как далеко назад рисуется канал
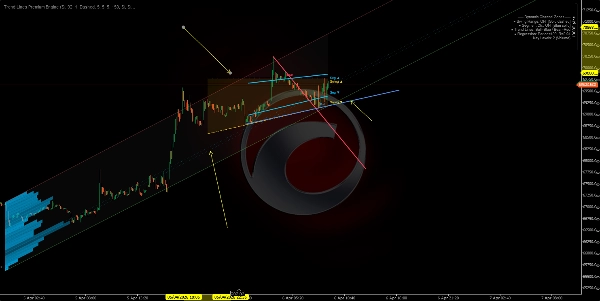
2️⃣ Segment Linear Channel
https://chartshots.spotware.com/c/69d3cb221bba1
Делит окно анализа на 5 равных сегментов, находит в каждом максимумы и минимумы, затем строит линию регрессии наименьших квадратов через 5 верхних точек и другую через 5 нижних точек.
Как это работает:
- Окно делится на 5 частей. Из каждой извлекается один представитель экстремума.
- Для каждой границы применяется линейная регрессия по этим 5 точкам.
- В результате получается канал, адаптирующийся к сегментированной структуре цены вместо простого соединения двух крайних точек.
Как читать:
- Восходящий канал → структурный восходящий тренд.
- Нисходящий канал → структурный нисходящий тренд.
- Повторные касания границы → динамическая поддержка/сопротивление.
Отличие от модуля 1: Swing Range соединяет только первый и последний экстремум. Segment Channel использует регрессию по 5 точкам, делая канал более плавным и менее чувствительным к отдельному экстремуму.
3️⃣ Swing Point Labels
Обнаруживает экстремумы и классифицирует их по 4 категориям структуры рынка:
Метка
Значение
Обозначает
HL
Higher Low (выше предыдущего минимума)
Бычья структура
HH
Higher High (выше предыдущего максимума)
Бычья структура
LH
Lower High (ниже предыдущего максимума)
Медвежья структура
LL
Lower Low (ниже предыдущего минимума)
Медвежья структура
Как это работает:
- Каждый новый минимум сравнивается с предыдущим минимумом. Если выше → HL. Если ниже → LL.
- Каждый новый максимум сравнивается с предыдущим максимумом. Если выше → HH. Если ниже → LH.
Как читать:
- Последовательность HL + HH → восходящий тренд сохраняется.
- Последовательность LH + LL → нисходящий тренд сохраняется.
- Переход HL в LL или LH в HH → сдвиг структуры (BOS/CHoCH).
По умолчанию отображаются только HL и LH для чистоты графика. HH и LL можно включить для полной видимости структуры.
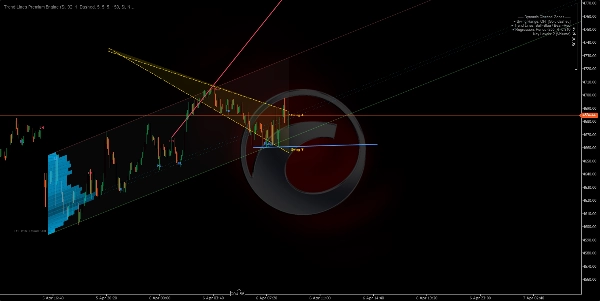
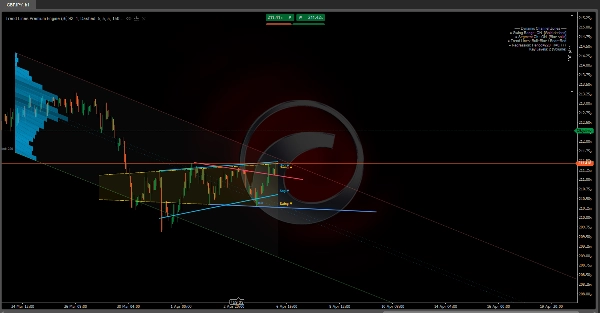
4️⃣ Автоматические трендовые линии
https://chartshots.spotware.com/c/69d3cc071272e
Рисует трендовые линии, соединяющие два последних минимума (бычья линия) и два последних максимума (медвежья линия). Активная линия выделена; предыдущие линии постепенно исчезают.
Как это работает:
- Обнаружен новый минимум → линия рисуется от предыдущего минимума к новому (бычья трендовая линия).
- Обнаружен новый максимум → линия рисуется от предыдущего максимума к новому (медвежья трендовая линия).
- Линия проецируется вперед на настраиваемое количество баров.
- При создании новой линии предыдущая становится полупрозрачной.
Сигналы пробоя (опционально): При включении индикатор определяет, пересекает ли цена закрытия активную трендовую линию:
- 🔼 Стрелка вверх → бычий пробой.
- 🔽 Стрелка вниз → медвежий пробой.
Параметр
Назначение
Max Line Pairs
Сколько пар линий оставлять видимыми. Установите 1 для максимально чистого вида
Max Extension Bars
Как далеко линия проецируется вперед. Предотвращает пересечение линий через весь график
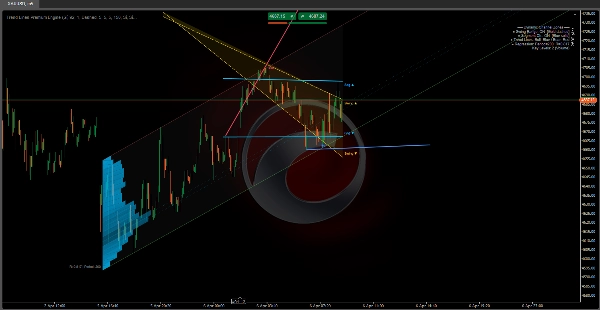
5️⃣ Динамическая зона регрессии
Самый продвинутый модуль. Вычисляет канал линейной регрессии по ценам закрытия и накладывает профиль активности (гистограмму), показывающий, где сосредоточен объем или количество касаний внутри канала. Также отмечает ключевые уровни в зонах с наибольшей активностью.
A) Канал регрессии:
- Применяется линейная регрессия наименьших квадратов к ценам закрытия за заданный период.
- Вычисляется стандартное отклонение цен от линии регрессии.
- Верхняя и нижняя границы располагаются на N стандартных отклонениях от центра (по умолчанию: 2.0).
- Опционально вычисляется в логарифмическом масштабе для лучшей точности на инструментах с высокой ценой или волатильностью.
B) Автоматическое определение периода:
- Алгоритм тестирует несколько периодов (от 50 до 400 баров) и вычисляет коэффициент корреляции Пирсона для каждого.
- Выбирается период с наивысшей корреляцией — где линейная регрессия лучше всего описывает движение цены.
- Значение корреляции отображается на графике (например, R = 0.85).
C) Гистограмма активности:
- Канал делится на горизонтальные секции (до 25).
- Для каждой секции алгоритм подсчитывает, сколько баров коснулось этого ценового уровня, с учетом объема или количества касаний (настраивается).
- Секции с большей активностью отображаются более длинными и непрозрачными барами.
- Это выявляет точку контроля (POC) и зоны высокой/низкой активности внутри канала.
D) Ключевые уровни:
- Секции с наибольшей активностью проецируются вперед в виде горизонтальных линий.
- Они служат поддержкой и сопротивлением на основе объема в контексте регрессии.
Как читать:
- Цена возле верхней границы → статистически перекупленная зона.
- Цена возле нижней границы → статистически перепроданная зона.
- R близко к 1 или -1 → сильный, надежный линейный тренд. R близко к 0 → боковик или регрессия незначительна.
- Ключевые уровни действуют как магнит для цены — зоны с исторической концентрацией активности склонны притягивать цену обратно.
🎯 Сценарии использования
Сценарий
Модули
Определение структуры рынка (бычья/медвежья/флэт)
Swing Labels + Trend Lines
Обнаружение динамической поддержки и сопротивления
Swing Range + Segment Channel
Поиск зон ценности по объему
Regression Zone + Key Levels
Подтверждение пробоев структуры
Trend Lines + Breakout Signals
Измерение силы тренда
Корреляция Пирсона (Regression Zone)
⚙️ Рекомендуемые настройки по стилю
Стиль
Рекомендуемые модули
Скальпинг (M1–M15)
Swing Labels + Trend Lines
Интрадей (M15–H1)
Все модули
Свинг-трейдинг (H4–D1)
Swing Range + Regression Zone + Key Levels
Чистый анализ структуры
Только Swing Labels + Trend Lines
⚠️ Важные заметки
Сводка
The five modules include:
1. Swing Range Connector: Detects recent swing highs and lows to draw a sloped channel representing the structural range.
2. Segment Linear Channel: Divides the analysis window into five segments, fitting regression lines through highs and lows for a smoother channel.
3. Swing Point Labels: Classifies swing highs and lows into four market structure categories (Higher High, Higher Low, Lower High, Lower Low) to indicate bullish or bearish trends and structure shifts.
4. Automatic Trend Lines: Connects the two most recent swing highs and lows with trend lines, highlighting active lines and optionally signaling breakouts.
5. Dynamic Regression Zone: Calculates a linear regression channel on closing prices with an activity histogram showing volume or touch concentration, marking key volume-based support and resistance levels.
The indicator supports various trading styles, recommending specific module combinations for scalping, intraday, swing trading, and pure structure analysis. It requires price bars and volume data and provides visualizations and signals including breakout, trend strength, and level touches or breaks.


![Логотип продукта "[Stellar Strategies] Visual Trend Momentum"](https://cdn.ctrader.com/image/webp/48aee0a5-f10e-4bc8-9671-78e156fcc5df_27548)


