Descripción
Sistema de Trailing Adaptativo 🚀
El Sistema de Trailing Adaptativo es un trailing stop adaptativo avanzado que utiliza volatilidad normalizada logarítmica para ajustar automáticamente los niveles de protección de ganancias. 📊 A diferencia de los trailing stops tradicionales con distancias fijas, este sistema calcula distancias dinámicas basadas en la volatilidad real del mercado, adaptándose constantemente a las condiciones cambiantes. 🔄
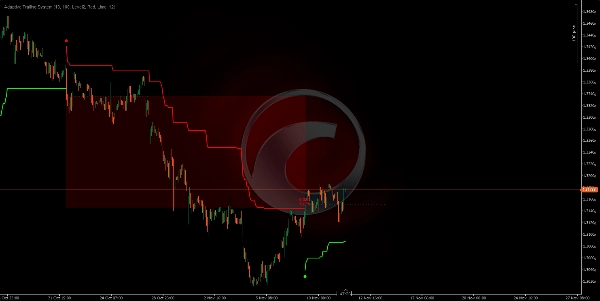
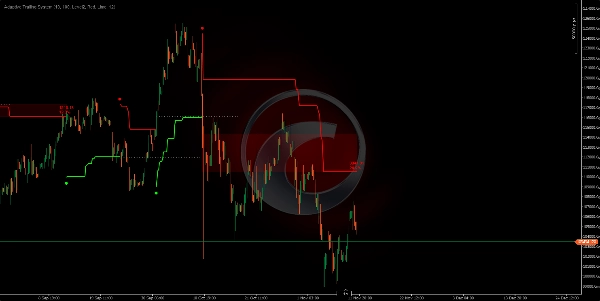
Spotware GBPUSD 691360763c684 | cTrader
Spotware XAUUSD 691360adf1386 | cTrader
Spotware XAUUSD 691360adf1386 | cTrader
Algoritmo Único de Trailing Adaptativo ⚙️
El sistema utiliza un método estadístico que nunca genera las mismas distancias de trailing:
• Calcula el True Range del precio durante un período configurable.
• Aplica una transformación logarítmica a estos valores para normalizar la distribución.
• Calcula la media y desviación estándar de estos valores logarítmicos.
• Genera una distancia de compensación única basada en los niveles de volatilidad (0, 1, 2 o 3 desviaciones estándar). 🎯
• El trailing stop se ajusta continuamente usando el precio típico (promedio de Alto, Bajo, Cierre).
Resultado: Cada momento del mercado tiene su propia distancia de trailing, calculada según la volatilidad específica de ese contexto. 🤖
Fundamento Técnico: Volatilidad Normalizada Logarítmica 🧠
¿Por qué una transformación logarítmica? 🤔
La volatilidad del mercado no sigue una distribución normal (Gaussiana); tiende a tener valores extremos. La transformación logarítmica:
- Normaliza la distribución: Convierte datos sesgados en una distribución más simétrica.
- Estabiliza la varianza: Reduce el impacto de picos extremos de volatilidad.
- Permite comparación estadística: Hace posible usar la desviación estándar de manera significativa.
Proceso de Cálculo del Offset 🔢
- True Range del período: Mide el rango máximo, considerando el Alto-Bajo del período y los gaps con el cierre anterior.
- Logaritmo natural: Aplica
ln(True Range)para normalizar. - Ventana de normalización: Mantiene los últimos N valores logarítmicos (período de normalización).
- Media logarítmica: Promedio de todos los
ln(TR)valores en la ventana. - Desviación estándar: Calcula la dispersión de los valores logarítmicos.
- Nivel de volatilidad: Multiplica la desviación por 0, 1, 2 o 3 según la configuración.
- Offset final:
Offset = e^(mean + level × deviation)- convierte de nuevo a la escala de precios. 💡
¿Cómo funciona? ⚡
Mecánica de Trailing Bidireccional
El sistema opera en dos modos alternos:
Modo BAJISTA (Corto): 📉
• El trailing stop se coloca ENCIMA del precio.
• Se actualiza hacia abajo cuando el precio cae (nunca sube).
• Señal de reversión cuando el precio CIERRA por encima del trailing stop.
Modo ALCISTA (Largo): 📈
• El trailing stop se coloca DEBAJO del precio.
• Se actualiza hacia arriba cuando el precio sube (nunca baja).
• Señal de reversión cuando el precio CIERRA por debajo del trailing stop.
Señales de Reversión:
• Un punto circular marca el cambio de tendencia (entrada de una nueva posición).
• Color verde = Nueva tendencia alcista (). ✅
• Color rojo = Nueva tendencia bajista (). 🔴
Parámetros e Impacto 🎛️
Período de Cálculo (10)
- Función: Define cuántas barras se usan para calcular el True Range.
- ↑ Más alto (20-50): Mide la volatilidad a largo plazo, más suave, menos sensible.
- ↓ Más bajo (5-8): Mide la volatilidad a corto plazo, más reactivo, detecta cambios rápidos.
Período de Normalización (100)
- Función: Ventana de valores logarítmicos para calcular la media y desviación estándar.
- ↑ Más alto (200-500): Normalización más estable, cambios graduales en el offset.
- ↓ Más bajo (50-80): Normalización más reactiva, el offset se adapta más rápido.
- Impacto crítico: Este parámetro determina cuán "memorizado" está el contexto histórico de volatilidad. 🧠
Nivel de Volatilidad (Nivel 2)
- Función: Número de desviaciones estándar aplicadas al cálculo del offset.
- Nivel 0 (0σ): Offset = media logarítmica = distancia más ajustada, máxima sensibilidad. 🎯
- Nivel 1 (1σ): Offset incluye 1 desviación = distancia moderada, captura ~68% de la variación.
- Nivel 2 (2σ): Offset incluye 2 desviaciones = distancia más amplia, captura ~95% de la variación (equilibrado). ⚖️
- Nivel 3 (3σ): Offset incluye 3 desviaciones = distancia muy amplia, captura ~99% de la variación, máxima tolerancia. 🛡️
___________________________________________________________________________________________________
🚀 Más de 10,000 traders ya usan nuestros MEJORES indicadores🏆
👉 Obtén todos nuestros sistemas TOP aquí:
_______________________________________________
📌 Indicadores de Estructura de Mercado
· ✅ AdvancedMarket Structure: Bos, Choch, SwinLevels, Order Blocks, Market Structure& Liquidity Finder
· 🔄 Dynamic Market StructureAnalysis of Turning Points
· 🧱 Order Block
· ⚖️ Market Imbalance
· ⛓️ BOS & CHOCH
· 🧠 ICT Power of 3
_______________________________________________
🔚 Sistemas de Salida Inteligente
_______________________________________________
📐 Indicadores ZigZag
· 🔍 ZigZag Price LiquidityProjection
· ➖ ZigZag
_______________________________________________
🧱 Indicadores de Soporte y Resistencia
· 🟩 SmartTrend Support &Resistance Lines
· 🧱 All Support and ResistanceLevels
_______________________________________________
📊 Indicadores de Tendencia y Canal
· 📊 Supertrend
_______________________________________________
💧 Herramientas de Volumen y Liquidez
_______________________________________________
⚡ Indicadores de Momentum y RSI
· 🔎 Multi-Level Candle Bias
Tracker
_______________________________________________
🔮 Herramientas de Predicción y Proyección
· 📐 Predicción basada en Linreg& ATR
· 📏 Regresión Lineal FibonacciMultitemporal
· 📈 Proyector de Flujo de Mercado Potenciado por Volumen_________________________________________________________________________________________________
Resumen
The system operates bidirectionally with two modes:
- Bearish (short) mode places the trailing stop above the price, adjusting downward as price falls, signaling a reversal when price closes above the stop.
- Bullish (long) mode places the trailing stop below the price, adjusting upward as price rises, signaling a reversal when price closes below the stop.
Reversal signals are visually marked with colored dots indicating trend changes (green for bullish, red for bearish). Key parameters include the calculation period for True Range, normalization period for volatility data, and volatility level defining the offset distance based on standard deviations.
This indicator supports various markets including Forex, cryptocurrencies, commodities, indices, and stocks, with symbols such as BTCUSD, EURUSD, GBPUSD, XAUUSD, NAS100, and USDJPY. It is designed to provide adaptive trailing stops that respond to real-time volatility, enhancing trade exit strategies.


![Logotipo de "[Stellar Strategies] Market Session Ultimate"](https://cdn.ctrader.com/image/webp/61ffd537-0125-4246-9e72-42eca1791d64_28232)