


Description
L'IDÉE
Un RSI qui traduit ses niveaux en prix et les trace directement sur le graphique, gardant le momentum et le prix dans le même espace au lieu d'un panneau séparé.
LE PROBLÈME
Le RSI est normalement lu dans un panneau séparé.
Pour l'utiliser, vous devez constamment comparer une valeur d'oscillateur avec ce que fait le prix sur le graphique principal.
Des niveaux tels que 70, 30 ou 50 sont des chiffres sur un oscillateur. Ils ne vous indiquent pas où le prix doit être pour que le RSI les atteigne.
Vous continuez donc à traduire à l'œil : « Le RSI est à 62 — où cela se trouve-t-il sur le graphique ? »
Le problème ne vient pas du RSI lui-même.
Le problème est que le momentum et le prix sont affichés à deux endroits différents, dans deux unités différentes.
LE CONCEPT FONDAMENTAL : LES NIVEAUX DU RSI DEVIENNENT DES NIVEAUX DE PRIX.
Le RSI traditionnel demande :
« Quelle est la valeur du RSI en ce moment ? »
RSI Overlay demande :
« À quel prix le RSI atteindrait-il ce niveau ? »
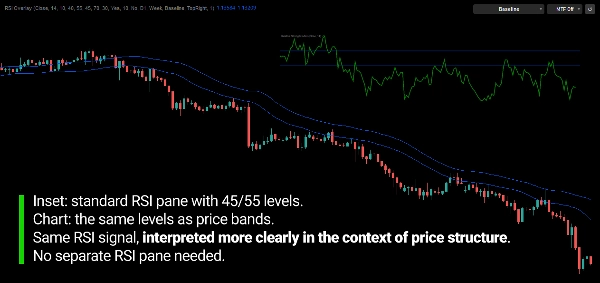
Chaque niveau de RSI est converti en niveau de prix correspondant et tracé directement sur le graphique.
L'oscillateur n'est plus quelque chose que vous lisez dans une fenêtre et traduisez dans une autre.
Son information est exprimée dans la même échelle de prix que le mouvement que vous analysez déjà.
Le RSI fixe le niveau. Le graphique le montre en prix.
CE QU'IL FAIT
RSI Overlay convertit les références RSI sélectionnées en niveaux de prix dynamiques et les affiche directement sur le graphique principal.
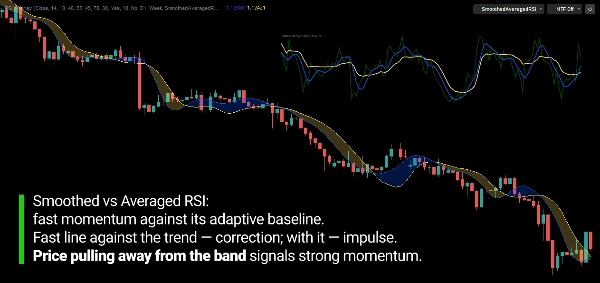
Les lignes de base Bull et Bear, les niveaux de surachat et de survente, ainsi que deux références basées sur le RSI, RSI lissé et RSI moyenné, sont tous représentés comme des lignes de prix.
Les lignes se mettent à jour à chaque nouvelle barre, elles reflètent donc l'état le plus récent du RSI plutôt que de rester fixes à un prix historique.
Ce ne sont pas des niveaux conventionnels de support ou de résistance.
Ils représentent le prix auquel la valeur RSI correspondante serait atteinte selon le calcul RSI actuel.
L'indicateur ne tente pas de prédire où le prix ira.
Il montre où le prix se situe par rapport aux niveaux RSI que vous observez.
COMMENT ÇA FONCTIONNE
- Le RSI est calculé en utilisant le lissage de Wilder.
- Chaque niveau de RSI est converti en prix qui le produirait.
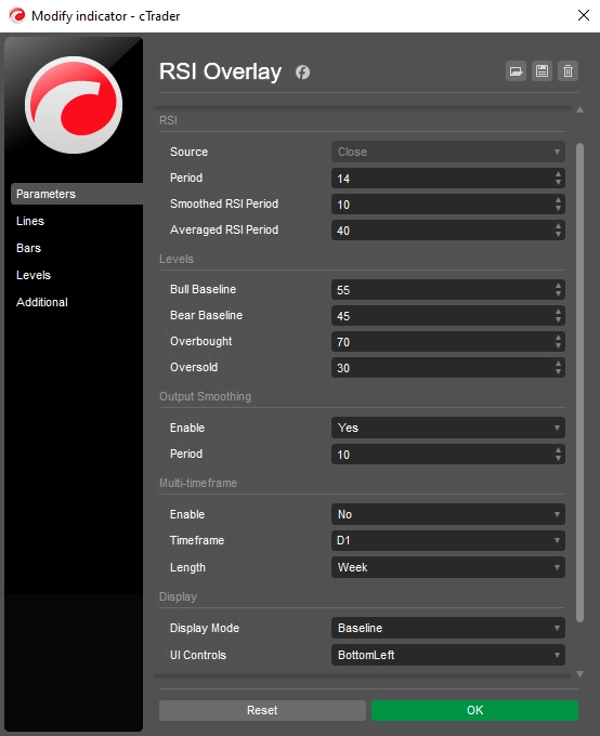
- Les lignes de base Bull et Bear marquent la zone de momentum autour de la ligne centrale (par défaut 55 / 45).
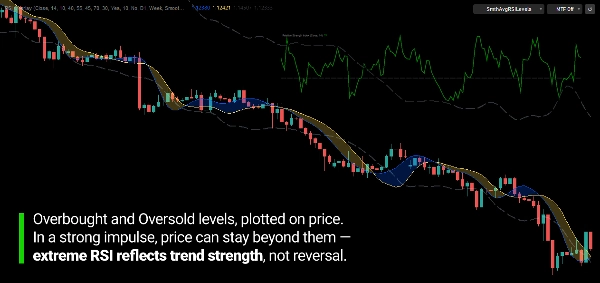
- Les niveaux de surachat et de survente sont convertis de la même manière (par défaut 70 / 30).
- Le RSI lissé et le RSI moyenné sont également convertis en lignes de prix.
LES RÉFÉRENCES RSI
Lignes de base Bull / Bear
Les niveaux de prix auxquels le RSI entrerait en territoire de momentum haussier ou baissier. L'espace entre eux montre où le momentum est neutre.
RSI lissé
Une version réduite en bruit du RSI, affichée comme une ligne de prix qui réagit plus en douceur.
RSI moyenné
Une moyenne adaptative plus lente du RSI, affichée comme une ligne de prix. Elle fournit une référence de momentum plus stable.
Surachat / Survente
Les niveaux de prix auxquels le RSI atteindrait les seuils de surachat et de survente.
Ces références ne sont pas des signaux automatiques.
Leur position relative au prix, et entre elles, fournit un contexte sur le développement du momentum.
CONTEXTE MULTI-TIMEFRAME
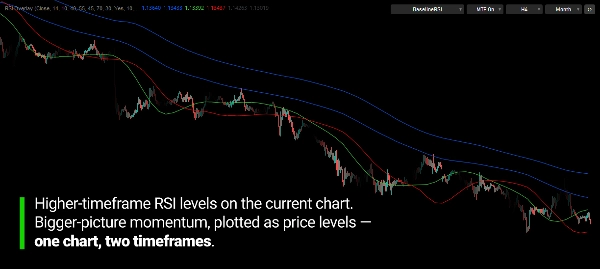
Le RSI ne doit pas nécessairement provenir de la période du graphique que vous regardez.
Par exemple, un RSI hebdomadaire ou mensuel peut être projeté sur un graphique H1.
Cela place le cadre de momentum de la période supérieure directement sur l'action des prix que vous observez.
Vous choisissez combien d'historique est tracé, de la dernière heure à plusieurs années.
La période sélectionnée doit être supérieure à celle du graphique.
CONTRÔLEZ-LE DEPUIS LE GRAPHIQUE
Onze modes d'affichage vous permettent de montrer uniquement ce dont vous avez besoin, d'une paire propre de lignes de base à l'ensemble complet des références RSI.
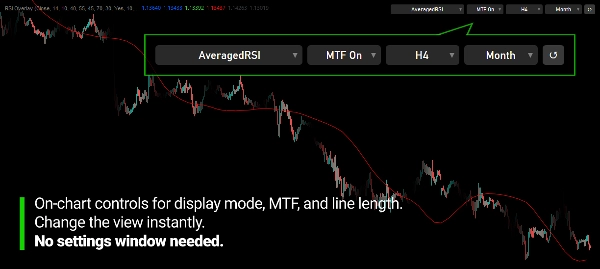
Une barre de contrôle compacte sur le graphique vous permet de changer le mode d'affichage, d'activer ou désactiver le multi-timeframe, et de modifier la période et la longueur sans rouvrir les paramètres.
Un bouton de réinitialisation remet tout à vos paramètres de départ.
La barre peut être placée dans n'importe quel coin ou cachée.
CE QUE VOUS POUVEZ OBSERVER
L'indicateur est conçu pour rendre plusieurs choses visibles :
- Où se situe le prix par rapport aux zones de momentum haussier et baissier
- À quelle distance le prix est des niveaux de surachat et de survente, en termes de prix
- Les changements de momentum autour des lignes de base
- Les replis et la continuation par rapport au RSI lissé et moyenné
- Le contexte de momentum de période supérieure sur un graphique de période inférieure
RSI Overlay est un outil de mesure, pas un système d'achat/vente autonome.
CONÇU POUR LE MOMENTUM EN TERMES DE PRIX
Le but n'est pas de remplacer le RSI.
C'est de supprimer le besoin de traduire un oscillateur en prix à l'œil.
Tout ce que vous savez sur le RSI s'applique toujours. Il est simplement montré là où les décisions sont réellement prises : sur le graphique des prix.
CARACTÉRISTIQUES CLÉS
- Niveaux RSI convertis en niveaux de prix sur le graphique principal
- Lignes de base Bull et Bear (par défaut 55 / 45)
- Niveaux de prix de surachat et de survente (par défaut 70 / 30)
- Ligne RSI lissée
- Ligne RSI moyennée
- RSI multi-timeframe sur des graphiques de période inférieure
- Longueur d'affichage sélectionnable pour les lignes multi-timeframe
- 11 modes d'affichage
- Barre de contrôle sur le graphique avec réinitialisation
- Source configurable, période RSI, lissage et moyennage
- Couleurs, styles de ligne et épaisseurs personnalisables
---
Le trading comporte des risques. Cet indicateur est un outil d'analyse technique et doit être utilisé conjointement avec une gestion appropriée des risques.
Résumé
It supports multi-timeframe analysis by allowing RSI data from higher timeframes (e.g., weekly or monthly) to be displayed on lower timeframe charts, providing broader momentum context. Users can customize display modes, line styles, colors, and control parameters directly from an on-chart control bar, which includes options to reset settings and adjust timeframe and length without reopening menus.
RSI Overlay serves as a measurement tool to visualize where price stands relative to momentum zones and RSI thresholds in price terms. It does not generate automatic trading signals but aids in observing momentum shifts, pullbacks, and continuations aligned with RSI levels on the price chart.
Avis clients
5 | 100 % | |
4 | 0 % | |
3 | 0 % | |
2 | 0 % | |
1 | 0 % |
Discussion
Questions fréquentes
Plus de cet auteur























Prix