

present
سجل واحصل على خصم 50 دولارًا على مشترياتك الأولى
Trading product for Killzone-Indicator مؤشر Forex Breakout, image 1
Killzone-Indicator
مؤشر
الإصدار 1.0، Apr 2026
Windows, Mac
4.2
التقييمات: 4
Trading product for Killzone-Indicator مؤشر Forex Breakout, image 2
Trading product for Killzone-Indicator مؤشر Forex Breakout, image 3
Trading product for Killzone-Indicator مؤشر Forex Breakout, image 4
4
المبيعات

الوصف

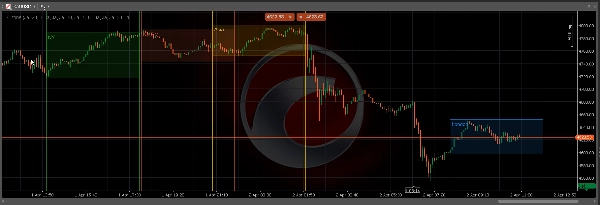
مؤشر جلسة Killzone — آسيا · لندن · نيويورك · نيويورك مساءً

يسلط الضوء تلقائيًا على جميع جلسات ICT Killzone الأربعة الرئيسية مباشرة على مخطط cTrader الخاص بك. لا رسومات يدوية، لا نوافذ مفقودة — يقوم المؤشر بحساب وعرض كل منطقة جلسة في الوقت الحقيقي.

─────────────────────────────

الميزات الرئيسية

─────────────────────────────

► أربع جلسات

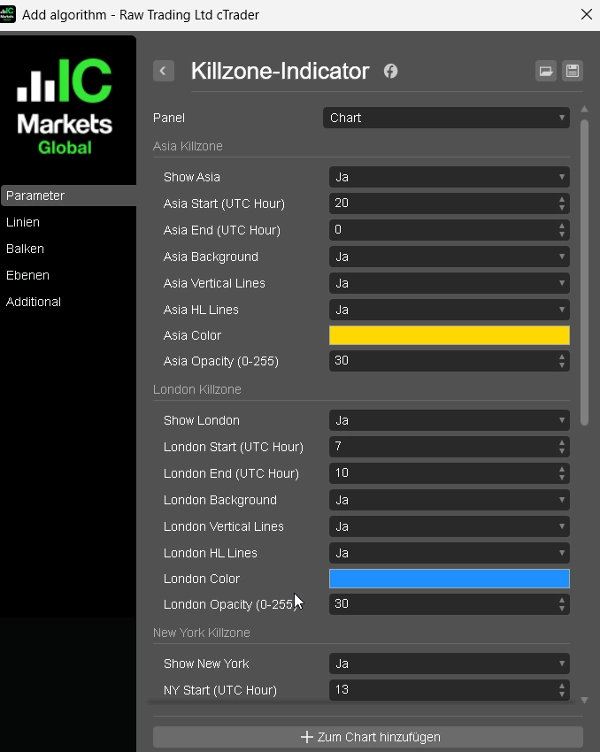
آسيا، لندن، نيويورك، ونيويورك مساءً — كل جلسة مستقلة تمامًا بوقت بدءها، ووقت انتهائها، ولونها، وخاصية التبديل الخاصة بها.

► تمييز الخلفية

مستطيل مملوء اختياري لكل منطقة جلسة — تعرف فورًا على Killzone النشطة على أي إطار زمني.

► خطوط القمة / القاع

خطوط أفقية واضحة عند القمة والقاع للجلسة — المستويات الرئيسية للتلاعب، والانعكاس، وتأكيد الدخول.

► خطوط الحدود العمودية

خطوط عمودية اختيارية عند فتح وإغلاق الجلسة — لفصل بصري واضح بين الجلسات.

► اختيار اللون الحر

لكل جلسة منتقي لون cTrader خاص بها مع قابلية ضبط الشفافية (0–255).

► إمكانية ضبط الرجوع للخلف

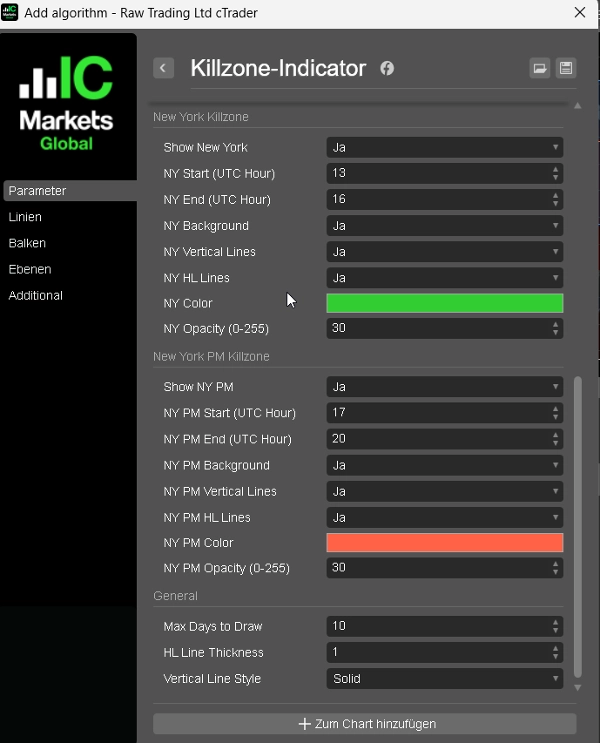
ارسم حتى 60 يومًا من مناطق الجلسات التاريخية — مثالي للاختبار الخلفي وتحليل الجلسات.

─────────────────────────────

أوقات الجلسات الافتراضية (UTC)

─────────────────────────────

آسيا → 20:00 – 00:00

لندن → 07:00 – 10:00

نيويورك → 13:00 – 16:00

نيويورك مساءً → 17:00 – 20:00

جميع الأوقات قابلة للتعديل بالكامل لتتوافق مع وقت خادم الوسيط الخاص بك.

─────────────────────────────

كيفية الاستخدام

─────────────────────────────

1. قم بإرفاق المؤشر بأي مخطط وإطار زمني.

2. اضبط أوقات الجلسات لتتوافق مع وقت خادم الوسيط الخاص بك (UTC بشكل افتراضي).

3. قم بتمكين أو تعطيل الخلفية، والخطوط العمودية، وخطوط القمة/القاع لكل جلسة.

4. اختر اللون والشفافية المفضلين لكل جلسة.

5. اضبط الحد الأقصى للأيام للتحكم في عدد الجلسات التاريخية التي يتم رسمها.

مستويات القمة والقاع للجلسة هي نقاط المرجع الأساسية الخاصة بك — استخدمها لدخول Killzone، وتحديد وقف الخسارة، وأهداف السيولة.

─────────────────────────────

مثالي لـ

─────────────────────────────

✔ متداولي ICT / SMC الذين يعملون بمفاهيم Killzone

✔ تحليل التلاعب والانعكاس القائم على الجلسات

✔ التداول بتلاقي كتلة الأوامر وفجوة القيمة العادلة

✔ متداولي FTMO / شركات التداول التي تحتاج إلى هيكل جلسة واضح

─────────────────────────────

التوافق

─────────────────────────────

المنصة : cTrader (ويندوز وماك)

اللغة : C# / cAlgo

الأطر الزمنية : جميعها (M1 إلى W1)

الأدوات: الفوركس، الذهب، المؤشرات، العملات الرقمية

الملخص

ملخص الذكاء الاصطناعي
The Killzone Session Indicator for cTrader automatically highlights four major ICT Killzone trading sessions—Asia, London, New York, and New York PM—directly on your chart in real time. Each session is independently configurable with customizable start and end times, colors, and toggles. The indicator visually marks session zones with optional background highlights and vertical boundary lines for clear separation. It also plots horizontal lines at each session’s high and low levels, which serve as key reference points for manipulation, reversal, and entry confirmation. Users can adjust opacity and colors per session and set a configurable lookback period to display up to 60 days of historical session zones, aiding in backtesting and analysis. The default session times are set in UTC but can be adjusted to match any broker’s server time. Compatible with all timeframes (M1 to W1) and instruments including Forex, Gold, Indices, and Crypto, this indicator supports traders employing ICT, Smart Money Concepts, order flow, and session-based strategies. It is designed for use on the cTrader platform (Windows and Mac) and coded in C# (cAlgo).
ملف تعريف المؤشر
فئة المؤشر
هيكل السوق (SMC)
نوع المخرجات
التصور
متطلبات البيانات
أعمدة السعر فقط
الإشارات المدعومة
تقاطع
الانقطاع
الانعكاس
كسر المستوى
نطاق فتح الجلسة

تقييمات العملاء

4.2
التقييمات: 4
5
25 %
4
75 %
3
0 %
2
0 %
1
0 %
تقييمات العملاء
April 9, 2026
Demo first, then maybe small size if the notes look sane. Weak ideas still need to be skipped.
April 5, 2026
April 5, 2026
ngl, structure is easier to read and that is enough to keep testing it. Overconfidence is the part to watch.
April 5, 2026
The decision feels less rushed, but the stop still matters.

مناقشة

الأسئلة الشائعة

Forex
Breakout
Indices
EURUSD
Commodities
GBPUSD
NZDUSD
Prop
Fair Value Gap
SMC
Stocks
XAUUSD
NAS100
USDJPY
يتم توفير المنتجات المتاحة من خلال cTrader Store، بما في ذلك روبوتات التداول والمؤشرات والإضافات، من قبل مطوري الطرف الثالث وإتاحتها لأغراض الوصول المعلوماتي والفني فقط. cTrader Store ليس وسيطًا ولا يقدم نصائح استثمارية أو توصيات شخصية أو أي ضمان للأداء المستقبلي.

المزيد من هذا المؤلف

مؤشر
SMC
Prop
+5
Automatically draws the Opening Range (High & Low) for Tokyo, London, and New York sessions. Configurable start times,
مؤشر
Liquidity Grab
Liquidity Sweep
+2
Visualizes accumulation ranges, manipulation sweeps and distribution phases on your cTrader chart.
مؤشر
BOS
Key Levels
+2
Maps bullish and bearish order block zones, CE levels and structure-based price action context.
مؤشر
MSS
Key Levels
+2
Maps equal highs, equal lows and active liquidity pools directly on your cTrader chart.
مؤشر
MSS
Key Levels
+4
Maps session ranges, previous highs/lows, equilibrium and premium/discount zones on your cTrader chart.
مؤشر
BOS
MSS
+3
Maps BOS, CHoCH, swing breaks and market structure shifts directly on your cTrader chart.
مؤشر
EMA
RSI
+2
Compact premium cTrader dashboard for market bias, sessions, premium/discount context, liquidity direction, ADR range an
cBot
ATR
EMA
+4
Professional Supply & Demand Execution Bot for cTrader. CS Apex Hunter Pro is a fully automated execution bot designed
7.6%
العائد على الاستثمار
3.17
عامل الربح

قد يعجبك أيضًا

مؤشر
ATR
Channel
Reversal Trap Probability Bands plots a dynamic volatility envelope around price & automatically detects "trap" reversal
مؤشر
Volume
Channel
+5
Spots volatility squeezes before they fire — the compression phase everyone else misses.
مؤشر
Prop
Forex
+13
Color Volume Bars – Visualize Market Strength Instantly
مؤشر
BOS
CHOCH
+5
MyZTrade High TF candle is a multi-timeframe visualisation tool that overlays completed higher-timeframe candles.
مؤشر
RSI
SMC
+3
High Low Divergence is a clean, overlay indicator that automatically identifies swing highs and swing lows
شعار "MA Sabres"
الأعلى تقييمًا
4.2
(4)
$19
مؤشر
Conquer the markets with MA Sabres! This indicator spots trend flips with MAs and cool Sabre shapes & alerts.
مؤشر
Smart Liquidity Zones PRO auto-detects liquidity grabs, wicks, traps & manipulations — trade like the smart money.
مؤشر
Key Levels
Support & Resistance
Draws a colored High/Low/Open/Close box for any custom time range you set — trade breakouts & retests.
مؤشر
RSI
Signal
+1
🚀📈 Plot buy/sell signals on Range Bars using Moving Averages and RSI. Clear, actionable trading insights.🚀📈
شعار "CandleColourFlow_MultiFx"
الأعلى تقييمًا
4.4
(5)
$19
مؤشر
CandleColourFlow MultiFx - optimized to work on Fx Majors, Fx MInors, Fx Crosses
مؤشر
Prop
Forex
+4
Automatic Support/Resistance zones from swing points.
شعار "Osvolt Trend Hunter"
الأعلى تقييمًا
4.6
(5)
$19
/
$25
مؤشر
ATR
RSI
+16
Multi-timeframe trend indicator using EMA, MACD & ADX to confirm high-probability buy and sell bias.
مؤشر
AI
ATR
+27
🔮 Smart Bar Predictor - Professional Volatility Forecasting Indicator
مؤشر
BOS
Fibonacci
+4
Automatically draws major trading sessions, killzones, and SMC daily liquidity targets directly on your cTrader charts.
مؤشر
Customize your Moving Average! Choose any timeframe and price source for precision and flexibility in your analysis.
مؤشر
Forex
Customizable multi-timeframe pivot point indicator for cTrader with alerts, Fibonacci, CPR, and more!
شعار "ICT Killzones & Macros"
الأعلى تقييمًا
4.7
(4)
$20
/
$30
مؤشر
SMC
Prop
+8
KILLZONES AND MACRO SESSIONS
مؤشر
Key Levels
Spots key hourly ranges and signals breakouts using arrows & colored background zones. Ideal for Gold.

السعر

4
المبيعات

























