الوصف
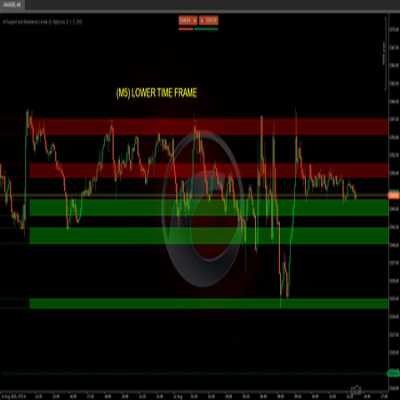
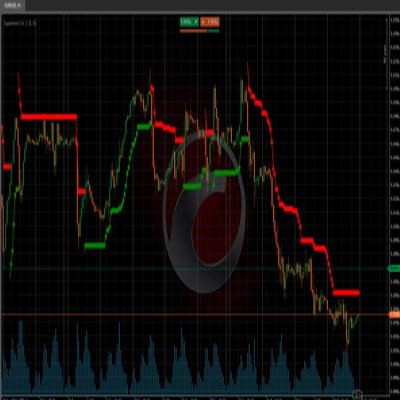
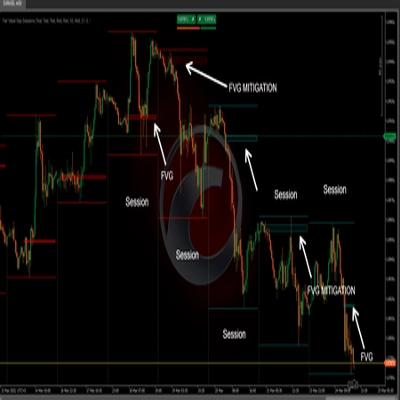
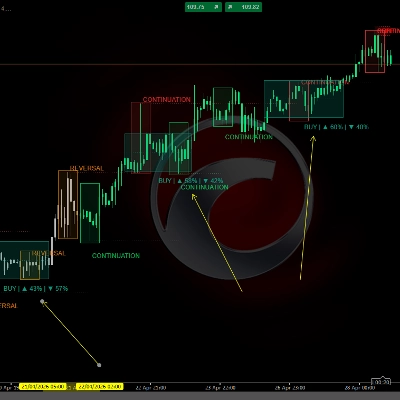
Nexo Structure Atlas is a professional-grade technical analysis tool designed for traders who operate based on market structure and institutional cycle dynamics. The indicator automates the identification of ranges, structural phases, and key turning points, projecting intuitive visual guides directly onto the chart.
📊 Market data and conditions analyzed
https://chartshots.spotware.com/c/6acd2589646ae
The indicator processes price action on both the current chart and higher timeframes. It analyzes:
- Price ranges, ATR amplitudes, and swing widths (pivots).
- Development and transition of accumulation, distribution, reaccumulation, and redistribution phases.
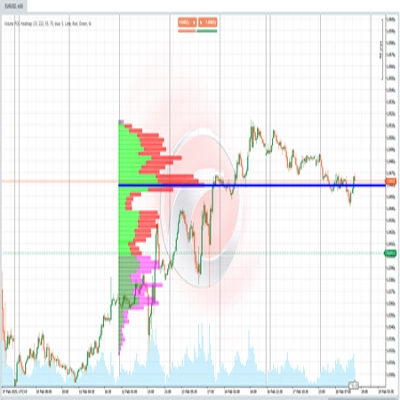
- Stopping actions, terminal tests, and institutional support/resistance liquidity levels.
https://chartshots.spotware.com/c/6acd25cee9110
👁️ How to interpret visual elements and signals
https://chartshots.spotware.com/c/6acd260deee0e
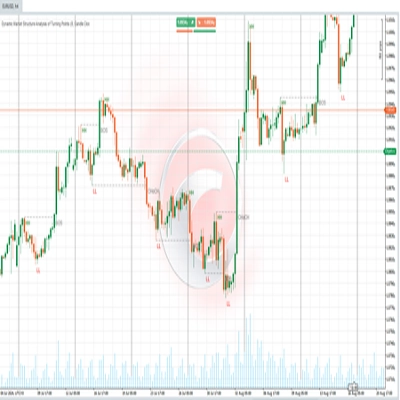
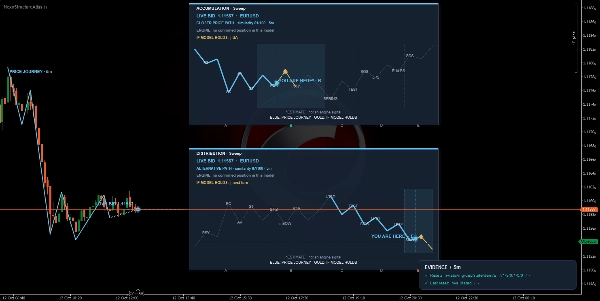
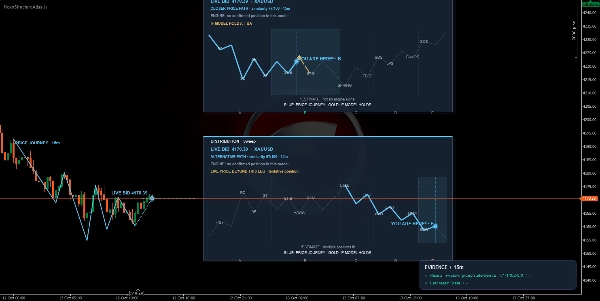
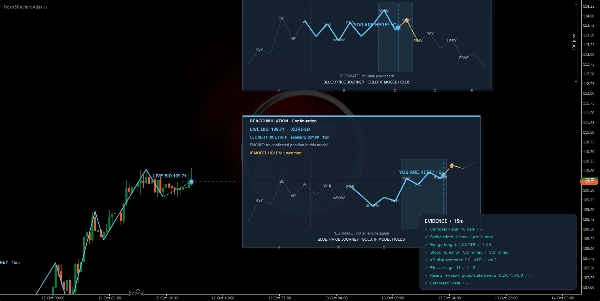
- Reference Cards: Optional overlapping panels showing ideal schemas of the current cycle (e.g., sweep or accumulation/distribution models), allowing you to visually compare where the price is within the theoretical model.
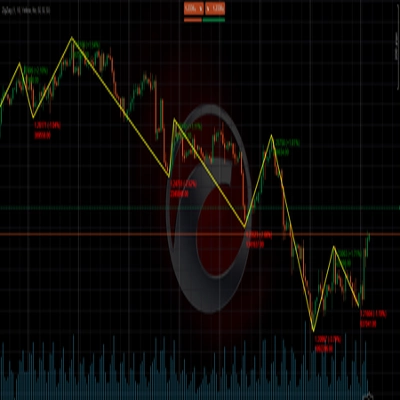
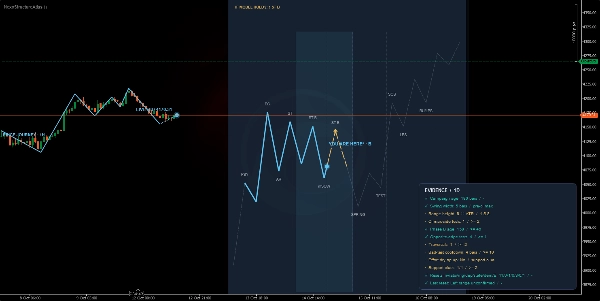
- Price Journey Trace: Draws significant price movements and swings on the chart to clearly visualize trend structure and character changes.
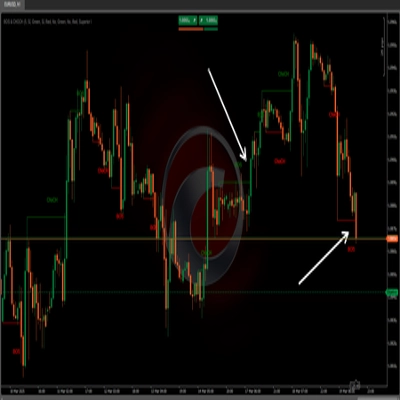
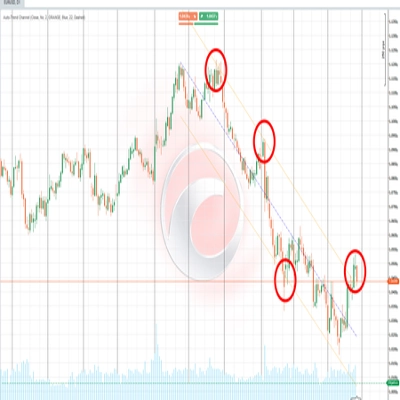
- Entry Badges: Visual markers on the chart signaling potential high-probability opportunities at key structural points (such as phase tests, support/resistance tests, and trend confirmations) according to the configured filtering policy.
- Evidence and Summary Dashboard: A discreet informational panel detailing critical metrics of the current campaign: phase age, range height in ATR, validation status, and support metrics.
⚙️ Key settings and parameters
https://chartshots.spotware.com/c/6acd26ad835f3
The indicator offers extensive customization divided into groups accessible from cTrader:
- Reference Atlas: Model selection (automatic or manual), number of visible reference cards, horizontal offset, and typography size.
- Structure and History: Activation of live paths, higher timeframe historical analysis, and filtering by minimum phases.
- Signals and Context: Entry qualification policies (Conservative, Standard, Aggressive) and selection of additional entry triggers.
- Dashboard and Visual Identity: Full color customization (jade tones for demand, coral for supply, surface and text colors), range opacities, line thicknesses, and sound alerts for confirmed entries.
🎯 Use cases and trading scenarios
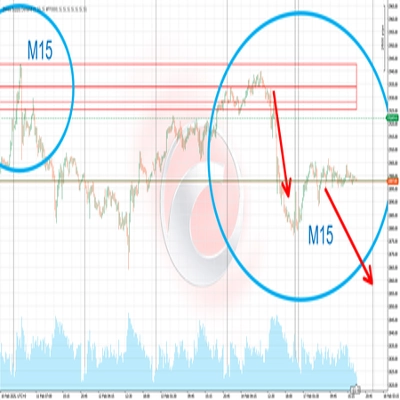
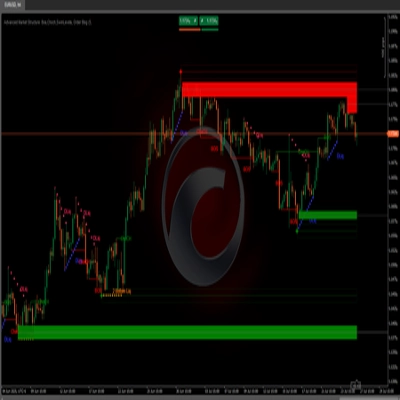
- Institutional Range Identification: Ideal for detecting when an asset is building cause (accumulation/reaccumulation) or effect (distribution/redistribution).
- Turning Point Trading: Using entry badges and phase tests to look for position entries favoring the main structural movement with defined risk management.
⚠️ Important limitations and usage notes
- The indicator requires time-based charts (minutes, hours, days, weeks, or months).
- It is an advanced technical analysis and decision-support tool; it does not constitute automated financial advice or guarantee profits on its own. Proper risk management and validation with your own operational strategy are recommended.