present
Inscrivez-vous et bénéficiez d'une remise de 50 $ sur votre premier achat
Trading product for TradeLens Indicateur Chart UI Tools Key Levels, image 1
TradeLens
Indicateur
Version 1.3, Sep 2026
Windows, Mac
4.5
Avis : 4
Trading product for TradeLens Indicateur Chart UI Tools Key Levels, image 2
Trading product for TradeLens Indicateur Chart UI Tools Key Levels, image 3
Trading product for TradeLens Indicateur Chart UI Tools Key Levels, image 4
Trading product for TradeLens Indicateur Chart UI Tools Key Levels, image 5
Trading product for TradeLens Indicateur Chart UI Tools Key Levels, image 6
Trading product for TradeLens Indicateur Chart UI Tools Key Levels, image 7
Trading product for TradeLens Indicateur Chart UI Tools Key Levels, image 8
Trading product for TradeLens Indicateur Chart UI Tools Key Levels, image 9
Trading product for TradeLens Indicateur Chart UI Tools Key Levels, image 10
Trading product for TradeLens Indicateur Chart UI Tools Key Levels, image 11
Depuis le 09/02/2026
29
Ventes
179
Installations gratuites

Description

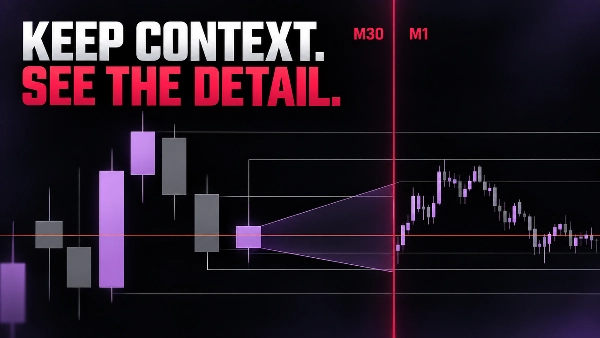
TRADELENS - GARDER LE CONTEXTE. VOIR LE DÉTAIL.

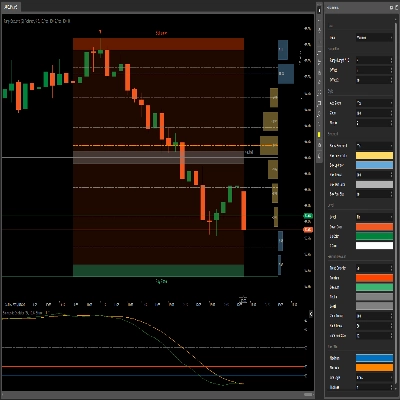
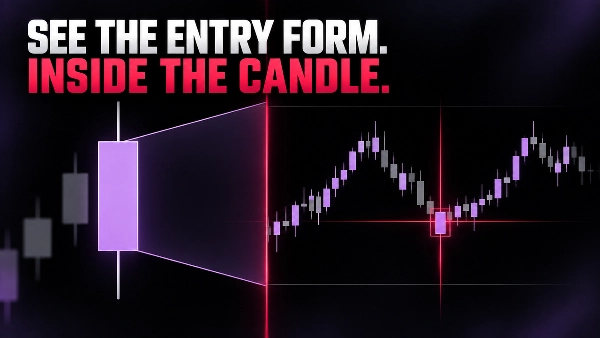
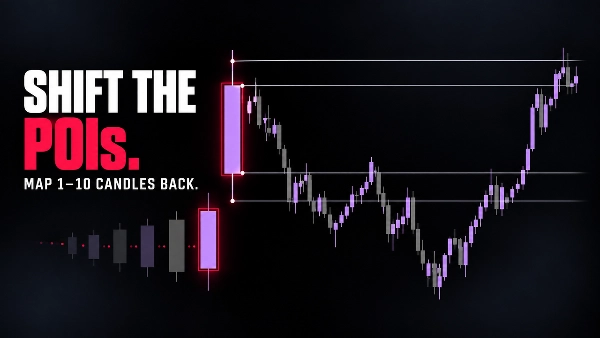
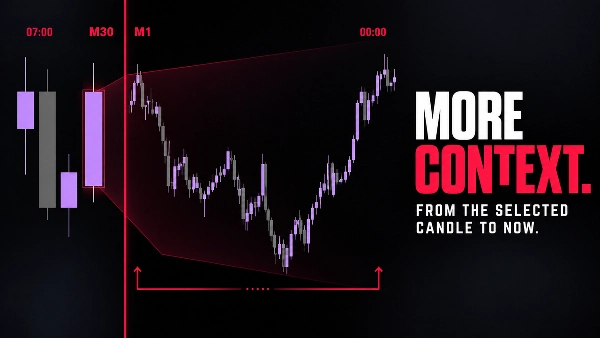
TradeLens place une vue compacte de chandeliers à plus court terme directement dans votre graphique actuel. Le graphique original reste votre contexte à plus long terme ; le panneau de détail montre comment le prix évolue à l’intérieur du chandelier de contexte sélectionné.

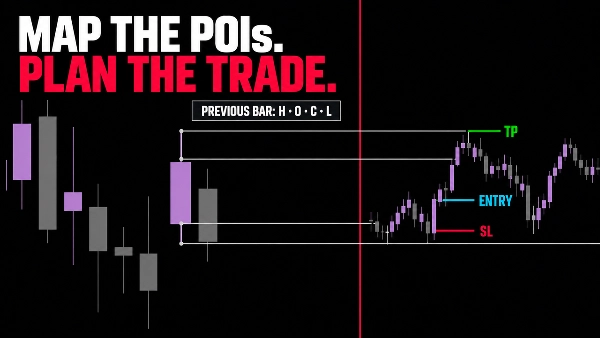
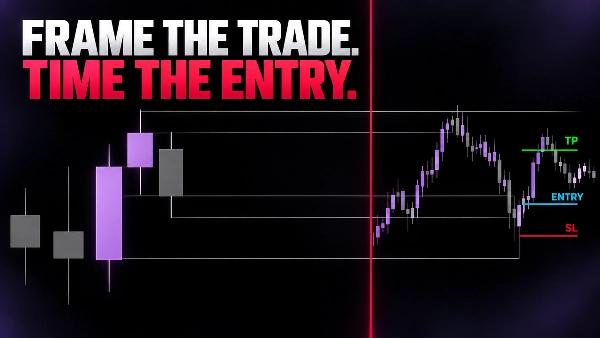
Utilisez par défaut le chandelier en formation actuel, ou revenez en arrière pour inspecter un chandelier de contexte antérieur. Vous pouvez encadrer la configuration active avec des POI optionnels (rayons) au plus haut, plus bas, ouverture et clôture de la barre précédente fermée, puis étudier le mouvement à plus court terme sans quitter le graphique.

CE QUE TRADELENS VOUS AIDE À VOIR

  • Structure à plus long terme et détail à plus court terme dans la même fenêtre.
  • La progression du chandelier de contexte actuel à une échelle plus fine.
  • Points d’intérêt OHLC de la barre précédente à travers le graphique.
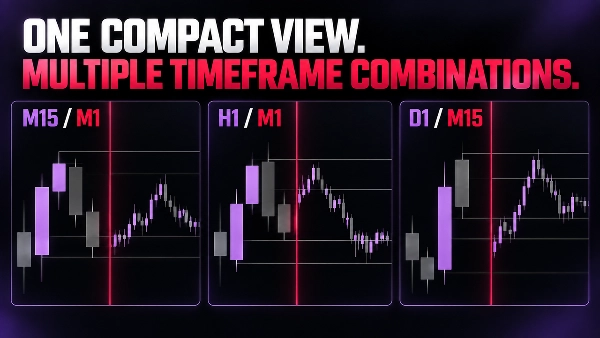
  • Combinaisons compactes telles que M15/M1, M30/M1, H1/M1, D1/M15 et D1/M30.
  • Une manière plus claire d’affiner le timing d’entrée tout en préservant le contexte.
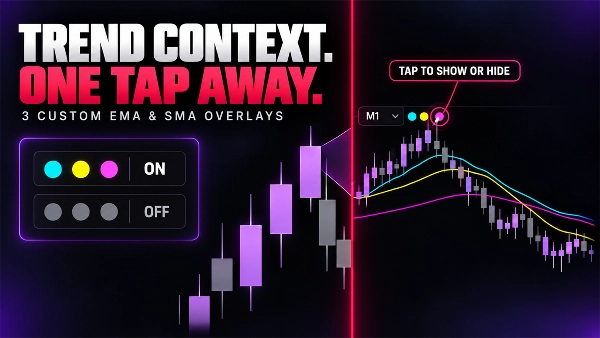
  • Ajoutez jusqu’à trois superpositions EMA ou SMA personnalisables.
  • Afficher ou masquer chaque moyenne instantanément avec des contrôles à une touche.
  • Voir la direction de la tendance directement dans la vue à plus court terme.

COMMANDES SIMPLES ET VISUELLES

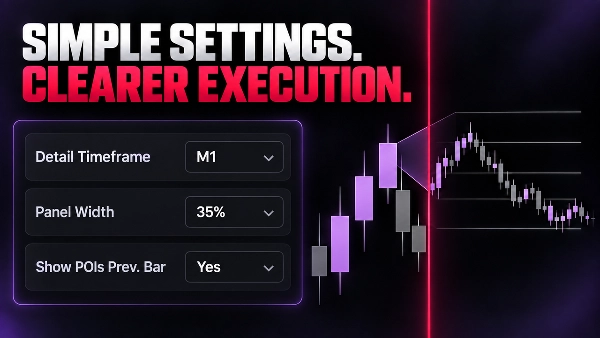
  • Cadre temporel de détail et décalage du chandelier de contexte.
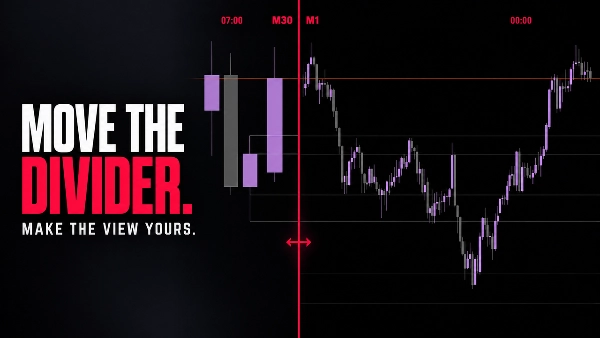
  • Largeur du panneau de détail, arrière-plan et opacité.
  • Couleurs des haussiers, baissiers, séparateurs et étiquettes.
  • POI optionnels de la barre précédente avec couleur et épaisseur configurables.

Le cadre temporel de détail doit être plus petit que celui du graphique. Si la combinaison est invalide, TradeLens cache sa visualisation et affiche une bannière de configuration claire.

TradeLens est un outil d’analyse visuelle. Il ne place, ne modifie ni ne gère les ordres. Les exemples présentés dans la galerie illustrent un flux de travail de lecture de graphique et ne constituent pas des recommandations de trading ni des garanties de performance.


Résumé

Résumé IA
TradeLens is a chart visualization tool designed to integrate two timeframes within a single trading chart. It embeds a compact lower-timeframe candle view inside the current higher-timeframe chart, allowing traders to observe detailed price action within the context of a broader market structure. Users can analyze the progression of the current or previous context candles at a finer scale without switching charts.

Key features include optional points of interest (POIs) marking the previous bar’s Open, High, Low, and Close levels, customizable visual settings such as detail panel size, background opacity, and color schemes for bullish, bearish, and separator elements. TradeLens supports common timeframe combinations like M15/M1, M30/M1, H1/M1, D1/M15, and D1/M30, ensuring the detail timeframe is always smaller than the context timeframe.

This tool facilitates refined entry timing by preserving higher-timeframe context while providing granular lower-timeframe insights. It is a visual analysis indicator and does not execute or manage trades. TradeLens is tagged under market structure and chart UI tools, supporting analysis related to key levels, liquidity sweeps, market structure changes, and inducements.
Profil de l'indicateur
Catégorie de l'indicateur
Structure du marché (SMC)
Type de résultat
Visualisation
Exigences en matière de données
Barres seulement

Discussion

Avis clients

4.5
Avis : 4
5
50 %
4
50 %
3
0 %
2
0 %
1
0 %
Avis clients
October 24, 2026
smaller candles inside the larger one are an elegant way to retain the path within the wider move, with optional previous OHLC giving the comparison useful reference points instead of adding entry signals.
October 8, 2026
M1 candles inside an H1 candle keep the little moves and the bigger picture together. Previous OHLC can be added when needed. A handy comparison overlay, with the detail period required to stay smaller than the context period.
October 4, 2026
TradeLens displayed an embedded M1 candle view on EURUSD H1 and XAUUSD H1, M10 and Month1. Three moving averages, timeframe labels and the separator were visible. The invalid M1/M1 combination correctly triggered a clear warning. The interface works well, although low contrast and compressed detail candles can affect readability, especially on higher timeframes.
October 2, 2026
keeping M1 detail inside H1 context is a useful comparison view, with optional previous OHLC references and a clear requirement for the detail period to remain smaller than the larger candle.

Questions fréquentes
Chart UI Tools
Key Levels
Liquidity Sweep
CHOCH
Inducement
Market Structure
Liquidity Grab
Les produits disponibles sur cTrader Store, notamment les bots de trading, les indicateurs et les plug-ins, sont fournis par des développeurs tiers et mis à disposition à titre informatif et à des fins d'accès technique uniquement. cTrader Store n'est pas un courtier et ne fournit aucun conseil en investissement, aucune recommandation personnelle ni aucune garantie quant aux performances futures.

Plus de cet auteur

Indicateur
BOS
CHOCH
+5
Spot market structure shift with ease, overlay timeframes, avoid false breakouts with open close pivots, hide chart bars
Indicateur
Volume
Imbalance
+5
Spot Institutional Order Flow with Proportional Volume Bubbles & Integrated Cumulative Volume Delta (CVD) Intelligence.
Indicateur
Forex
EURUSD
+5
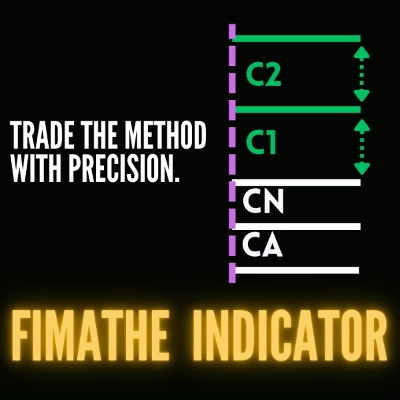
Fimathe Indicator - Fimathe PCM - Automated Trend Channels & Levels — Ideal for live trading and backteting
Logo de "ZigXRay"
Les mieux notés
4.6
(5)
$29
/
$49
Indicateur
CHOCH
Key Levels
+5
ZigZag Market Structure Identifier - Multi-Layer Scanner: Convergent Pivot Detection, 4-TF Overlay & Naked Chart Mode.
Plug-in desktop
Risk/Reward
Trade Journal
+5
cTrader Journal - Automatic Trade Capture. Offline Reviews. No Subscription.
Logo de "DrbcLevels"
Les mieux notés
4.0
(4)
$19
/
$29
Indicateur
Key Levels
Break & Retest
+5
Premium Discount Levels - Professional Dealing Range Zones with Draggable Lines, Alerts, Wartermark & Backtest Mode.
cBot
Fixed Lot
TP Manager
+5
Hotkeys Trading Assistant - Professional Shortcut Assitant with Risk Manager, Hotkeys & Lot Sizing.
Logo de "fvg_levels"
Les mieux notés
4.0
(4)
$19
/
$29
Indicateur
Key Levels
Order Block
+5
FVG Levels — Auto-Detection of Multi-Timeframe Fair Value Gaps & GAPs, Smart Filters and Liquidity Zone Monitoring

Vous pourriez aussi aimer

Indicateur
SMC
Prop
+14
an all-in-one Smart Money Concepts (SMC) toolkit featuring Premium/Discount zones.
Indicateur
AI
SMC
+11
Perfect Entry Price designed to help traders identify the most accurate and reliable price levels for market entries
Indicateur
VWAP
Forex
+5
Trade with institutional accuracy. Identify fair price levels and high-volume zones instantly!
Indicateur
ADX
ATR
+5
Configure, simulate, and analyze trading strategies with custom filters, multi-target exits, and detailed performance me
Indicateur
Boost your trading with Candlestick Patterns for cTrader – auto-detect key signals for smarter, faster decisions!
Indicateur
Doji
Volume
+5
Instantly spot high-liquidity institutional moves with clean, non-obtrusive triangle alerts on cTrader charts.
Indicateur
Forex
BTCUSD
+5
Trend analysis, automatic analysis, position, swingtrader, scalper
Indicateur
Grid
Prop
+5
This technical analysis indicator provides information on market sentiment, trend and price levels....
Indicateur
AI
ATR
+27
Supertrend Indicator
Indicateur
Volume
Order Block
+3
Map market structure, order blocks, liquidity and key zones with an interactive cTrader dashboard.
Indicateur
Volume
Imbalance
+1
Volume profile indicator that auto-detects the latest trendline. Shows POC, Value Area (VAH/VAL), and High Volume Nodes
Indicateur
AI
ATR
+26
Entry Momentum MACD Power Guide
Indicateur
Volume
Key Levels
View tick activity across a selected chart range with Point of Control, Value Area High and Value Area Low.
Indicateur
RSI
VegaXLR's cTrader StochRSI identifies overbought/oversold RSI levels for precise trade entries.
Indicateur
Forex
cTrader ZigZag Alerts: Precision Swing Detection, Alerts, and Fibonacci.
Indicateur
Prop
VWAP
+5
VWAP is a powerful tool for intraday traders
Indicateur
Doji
Wedge
+5
Angora Pattern Recognition is a cTrader indicator that finds, draws and tracks classic chart patterns automatically.
Indicateur
SMC
Prop
+13
Institutional FVG detection with HTF projection, precise volume deltas, and smart fill logic.

Prix

Depuis le 09/02/2026
29
Ventes
179
Installations gratuites