
説明
取引戦略で日次および週次のOHLCと中間価格に依存していますか?取引のたびに手動でマークするのに疲れていませんか?
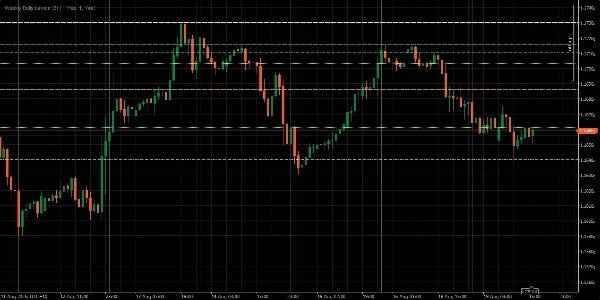
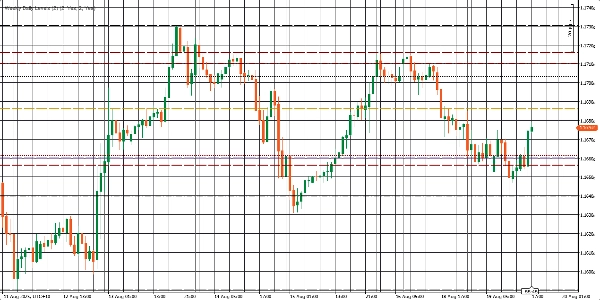
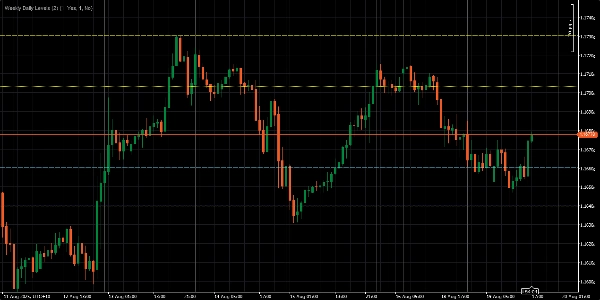
この Weekly Daily Levels Indicator はあなたのために重労働を行います。前日のおよび前週の始値、高値、安値、終値(OHLC)と中間価格を自動的にチャート上にプロットします。これにより、インジケーターが詳細を処理する間に戦略の実行に集中でき、取引がより簡単で迅速かつ効率的になります。
主な特徴:
- 日次および週次のOHLCと中間価格を即座に表示します。
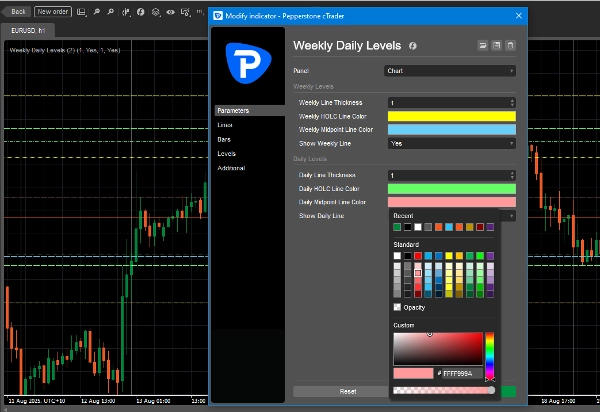
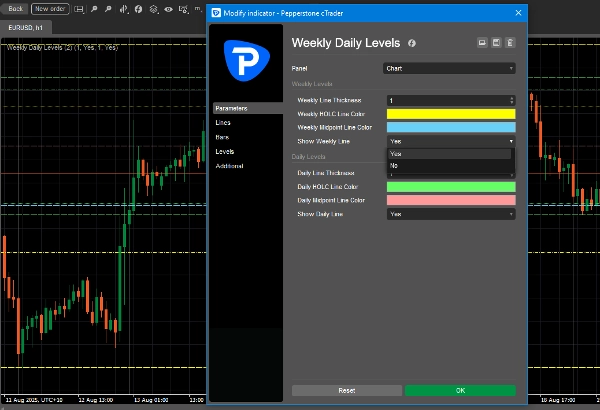
- チャートスタイルに合わせて線の色をカスタマイズできます。
- 日次または週次レベルをワンクリックでオン・オフ切り替え可能です。
- 視認性向上のために線の太さを調整できます。
概要
AIによる概要
The Weekly Daily Levels indicator automatically plots the previous day’s and previous week’s open, high, low, close (OHLC) prices along with their mid-points directly on trading charts. It provides instant visual reference to these key price levels, helping traders incorporate daily and weekly price data into their strategies without manual marking. Users can customize line colors and thickness to fit their chart style and toggle daily or weekly levels on or off with a single click. This indicator streamlines the process of tracking important historical price levels for improved trading efficiency.
インジケーターのプロフィール
カスタマーレビュー
5.0
レビュー: 2
5 | 100 % | |
4 | 0 % | |
3 | 0 % | |
2 | 0 % | |
1 | 0 % |
カスタマーレビュー
August 28, 2025
Not bad if the rules are already clear. Two timeframes give more context.
August 21, 2025
the good surprise is the setup needs less second guessing, and It works better with a written plan.
ディスカッション
よくあるご質問
cTrader Storeで入手可能な取引ボット、インジケーター、プラグインなどの商品は、第三者の開発者が提供するものであり、情報と技術の取得のみを目的としてご利用いただけます。cTrader Storeはブローカーではなく、投資助言や個人的な推奨を行うことも、将来のパフォーマンスを保証することもありません。


価格
登録日 19/04/2025
2
販売