
説明
説明:
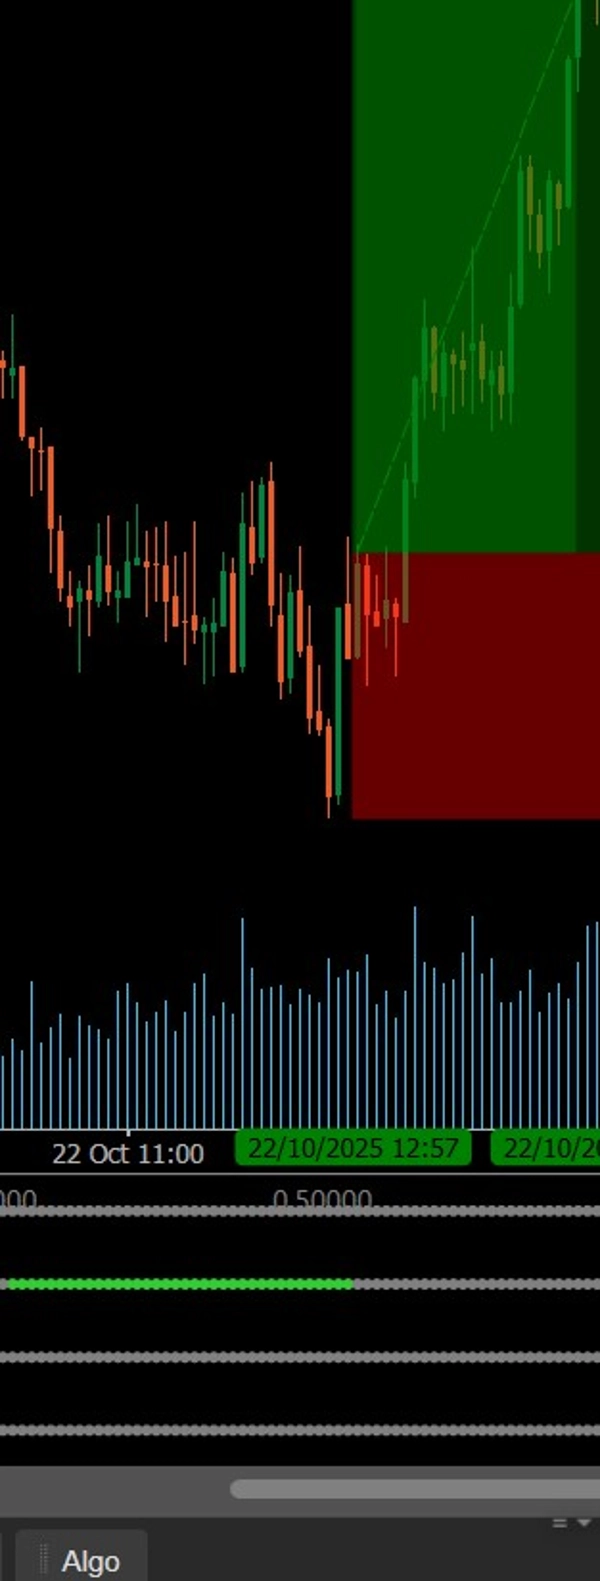
このインジケーターは、4つのカスタマイズ可能な時間枠にわたるRSIのトレンドを色分けされたドット(売られ過ぎは緑、買われ過ぎは赤、中立は灰色)で視覚化します。これにより、トレーダーは市場のモメンタムの整合性を瞬時に評価し、複数時間枠のRSI確認を特定してより強力なエントリーを行うのに役立ちます。
概要
インジケーターのプロフィール
カスタマーレビュー
4.0
レビュー: 1
5 | 0 % | |
4 | 100 % | |
3 | 0 % | |
2 | 0 % | |
1 | 0 % |
カスタマーレビュー
November 8, 2025
A few signals across sessions tell more, and the review screen feels calmer.
ディスカッション
よくあるご質問
BTCUSD
Prop
Forex
Scalping
Indices
EURUSD
Commodities
RSI
Crypto
Stocks
XAUUSD
Martingale
cTrader Storeで入手可能な取引ボット、インジケーター、プラグインなどの商品は、第三者の開発者が提供するものであり、情報と技術の取得のみを目的としてご利用いただけます。cTrader Storeはブローカーではなく、投資助言や個人的な推奨を行うことも、将来のパフォーマンスを保証することもありません。
この作成者の他の商品


価格
登録日 21/01/2025
3
販売