
Description
📊 Tableau de bord de la plage quotidienne en pips (outil ADR aligné sur la session)
Le Tableau de bord de la plage quotidienne en pips est un outil de trading professionnel qui affiche en temps réel les statistiques de la plage quotidienne directement sur votre graphique — entièrement aligné sur la session UTC de votre courtier.
Conçu pour les traders de précision, cet outil calcule la plage en pips High-Low en utilisant de véritables limites quotidiennes basées sur la session et fournit des statistiques roulantes puissantes pour le contexte du marché et l’analyse de la volatilité.
🔥 Fonctionnalités clés
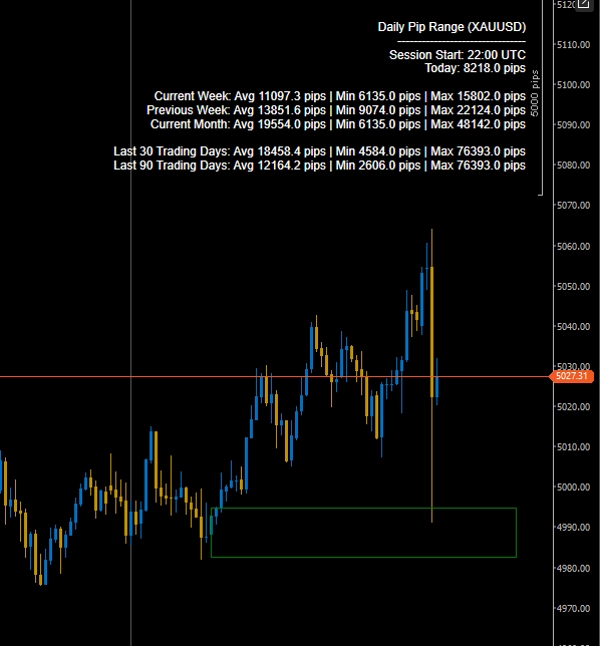
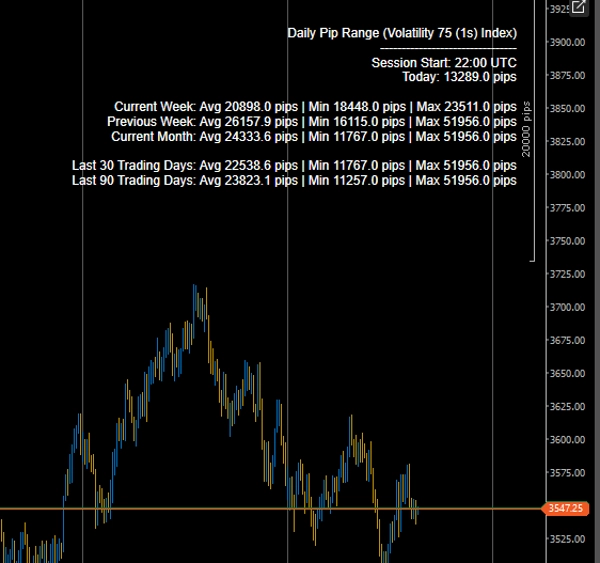
✅ Plage quotidienne en direct d’aujourd’hui (High–Low en pips)
Voir la plage en pips de la session en cours mise à jour en temps réel.
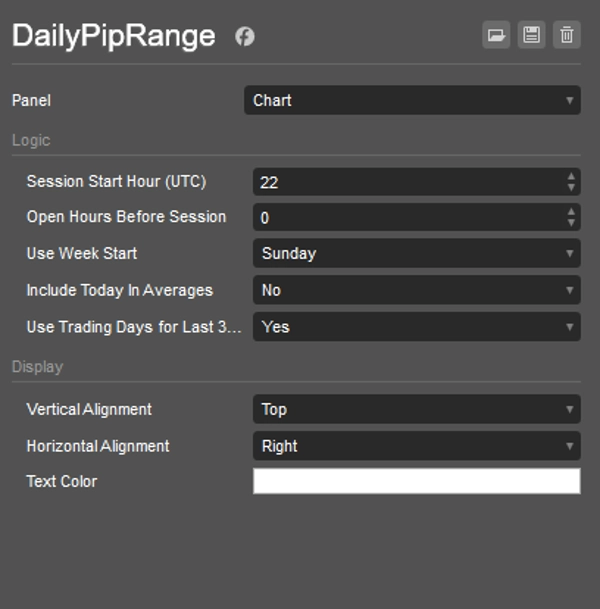
✅ Calculs alignés sur la session (contrôlés par UTC)
Définir :
- Heure de début de session (UTC)
- Heures d’ouverture avant la session
Cela garantit que vos statistiques quotidiennes correspondent à la journée de trading de votre courtier — idéal pour l’alignement sur la clôture de NY et l’analyse de style institutionnel.
✅ Répartition statistique avancée
Pour chaque période, l’indicateur affiche :
- Plage quotidienne moyenne
- Plage quotidienne minimale
- Plage quotidienne maximale
Périodes incluses :
- Semaine en cours
- Semaine précédente
- Mois en cours
- 30 derniers jours
- 90 derniers jours
✅ Basculer entre jours de trading ou jours calendaires
Choisissez entre :
- 30/90 derniers jours calendaires
- 30/90 derniers jours de trading (barres quotidiennes uniquement)
Parfait pour filtrer les week-ends et les écarts non commerciaux.
✅ Affichage personnalisable
- Position ajustable à l’écran (en haut à droite, etc.)
- Personnalisation de la couleur du texte
- Superposition légère et non intrusive
🎯 Pourquoi utiliser cet outil ?
- Identifier l’expansion et la contraction de la volatilité
- Comparer la plage d’aujourd’hui aux moyennes historiques
- Repérer la compression avant les cassures
- Filtrer les trades selon le contexte ADR
- Améliorer la taille du risque selon les conditions de volatilité
Que vous tradiez en intraday, en swing ou sur l’or, cet outil vous offre une intelligence immédiate de la volatilité sans encombrement.
⚙️ Idéal pour
- Traders Forex
- Traders de l’or (XAUUSD)
- Traders d’indices
- Systèmes basés sur la volatilité
- Traders de cassures
- Analyse de plage de style institutionnel
🚀 Conscience professionnelle de la volatilité - directement sur votre graphique
Conçu pour la performance, la précision et la précision des sessions.
Résumé
Avis clients
5 | 50 % | |
4 | 50 % | |
3 | 0 % | |
2 | 0 % | |
1 | 0 % |


![Logo de "[Stellar Strategies] MARSI Signal Plotter"](https://cdn.ctrader.com/image/webp/7b2b8da6-8f8e-4646-8d4a-4710c516c01e_25567)


