
SupportResistance
Indicateur
319 téléchargements
Version 1.0, Dec 2025
Windows, Mac
5.0
Avis : 1
Description
Support & Resistance Version Limitée
- Introduction d'un moteur léger de Support & Resistance alimenté exclusivement par H4 timeframe.
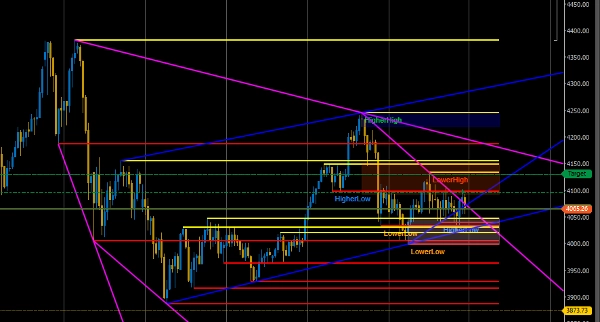
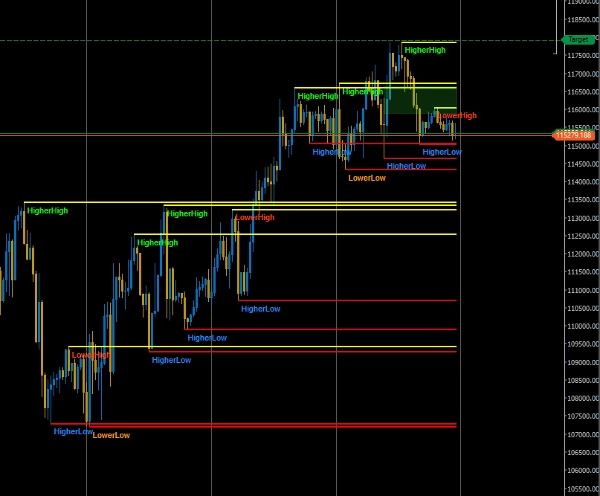
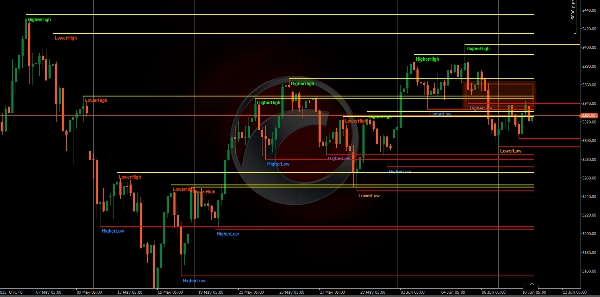
- Ajout de la détection automatique et du tracé des niveaux majeurs de Support et Resistance utilisant une logique basée sur les oscillations.
- Mise en œuvre de la limitation de symbole : fonctionne uniquement sur XAUUSD, garantissant un accès d'essai contrôlé.
- Ajout de la flexibilité du timeframe : l'indicateur peut être appliqué sur n'importe quel timeframe de graphique tandis que les niveaux SR restent verrouillés sur H4.
- Ajout d'une notification en haut à droite du graphique décrivant les limitations et les instructions de mise à niveau.
- Inclusion d'un système robuste de nettoyage des objets pour un redessin fluide et une performance stable.
- Amélioration du regroupement des niveaux SR par ajout d'un aplatissement basé sur les pips pour éliminer les niveaux en double ou qui se chevauchent.
Achetez Market Structure Pro pour la version complète
Résumé
Résumé IA
SupportResistance is an indicator designed to automatically detect and plot major support and resistance levels on trading charts using swing-based logic. It operates exclusively on the H4 (4-hour) timeframe to identify these key levels, while allowing application on any chart timeframe with the support and resistance levels remaining fixed to H4. The indicator is currently limited to the XAUUSD symbol (gold vs. US dollar) for controlled trial access. Features include highlighting pullbacks and break of structure (BOS) retests, filtering signals with candle confirmation, and improved level clustering through pip-based flattening to reduce duplicate or overlapping lines. It also incorporates a robust object-cleanup system to ensure smooth redrawing and stable performance. An on-chart notice provides information about limitations and upgrade instructions. This tool is intended to assist traders in identifying critical price levels and market structure on the XAUUSD market.
Profil de l'indicateur
Avis clients
5.0
Avis : 1
5 | 100 % | |
4 | 0 % | |
3 | 0 % | |
2 | 0 % | |
1 | 0 % |
Avis clients
December 10, 2025
SupportResistance auto-detects key price levels and keeps charts clean and structured. Great for intraday and swing traders looking for reaction zones. Lightweight and stable. Needs good sensitivity filtering to avoid level overload, but very solid as a core context tool.
Discussion
Questions fréquentes
BTCUSD
Forex
Signal
Breakout
Indices
EURUSD
Commodities
GBPUSD
NZDUSD
Prop
Supertrend
Crypto
Stocks
XAUUSD
NAS100
USDJPY
Les produits disponibles sur cTrader Store, notamment les bots de trading, les indicateurs et les plug-ins, sont fournis par des développeurs tiers et mis à disposition à titre informatif et à des fins d'accès technique uniquement. cTrader Store n'est pas un courtier et ne fournit aucun conseil en investissement, aucune recommandation personnelle ni aucune garantie quant aux performances futures.


![Logo de "[Stellar Strategies] Ultimate Trend & Momentum Dashboard"](https://cdn.ctrader.com/image/webp/e9a9c9e9-4b6c-4bc0-9988-4c4768a23b6c_30290)


Prix
Depuis le 31/10/2024
56
Ventes
1.73K
Installations gratuites